Demographics of Çakaristan: Difference between revisions
No edit summary |
No edit summary |
||
| (9 intermediate revisions by the same user not shown) | |||
| Line 1: | Line 1: | ||
{{Çakaristan Article}} | {{Çakaristan Article}} | ||
[[Çakaristan]] is the [[List of countries by population| | [[Çakaristan]] is the [[List of countries by population|most populous country]] on [[Micras]]. The last census of [[Shireroth]] showed that Çakaristan its neighbour had surpassed in population. | ||
A census is conducted every 10 Norton years, this is used to determine the number of seats in the [[Çakari Congress#Majlis al-Nuwaab|Majlis al-Nuwaab]]. The last census was in 1750 AN. | |||
In the 1720 census, [[Beneluccas]] and [[Sri Pashana]] could not be counted due to the [[Sanpo-Çakar War]]. In view of the 1725 elections, a mid-term census was held in those states in 1724 AN. As well as in the new states of [[Jaihabar]], [[Lija]] and [[Sanpantul]]. | Between 1690 and 1711 AN, population growth was mainly due to the growth of Çakaristan. More and more territory with its population came under the Çakar flag. The exception is the period of the [[Great Apollonian Empire]], between 1698 and 1704, during which the population is estimated at more than one billion. In the 1720 census, [[Beneluccas]] and [[Sri Pashana]] could not be counted due to the [[Sanpo-Çakar War]]. In view of the 1725 elections, a mid-term census was held in those states in 1724 AN. As well as in the new states of [[Jaihabar]], [[Lija]] and [[Sanpantul]]. Since then, relative peace has prevailed, increasing the population size at the 1740 census and the 1750 census. | ||
__TOC__ | __TOC__ | ||
| Line 32: | Line 32: | ||
=== 1720 - 1730 AN === | === 1720 - 1730 AN === | ||
The decade has seen steady population growth. This is due to an end to the Sanpo-Çakar War and relative peace. The numbers over the total would have been higher if Sanpantul had remained a princely state, but given that the state continued as an unincorporated territory, not included in the 1730 census. | The decade has seen steady population growth. This is due to an end to the Sanpo-Çakar War and relative peace. The numbers over the total would have been higher if [[Sanpantul]] had remained a princely state, but given that the state continued as an unincorporated territory, not included in the 1730 census. The Jaihabars were recognised in 1721 AN as a distinct ethnicity and separate population group with their own language, Jaihalam, which was also officially recognised. | ||
In this decade, only a former island of [[Lostisland]] was added to the Empire. The number of casualties of the [[Great Skerry-Valencian Drought (1720-1728)]], which affected [[Beneluccas]], [[Lija]] and [[Sri Pashana]], was fortunately not as high. | In this decade, only a former island of [[Lostisland]] was added to the Empire. The number of casualties of the [[Great Skerry-Valencian Drought (1720-1728)]], which affected [[Beneluccas]], [[Lija]] and [[Sri Pashana]], was fortunately not as high. | ||
=== 1730 - 1740 AN === | |||
Again, the population grew steadily in the last decade. The growth is mainly natural increase, as no areas were added to the empire. [[Hrithik's rebellion]] took place in the relatively sparsely populated [[Tartaristan]], so civilian casualties were not too high. Leaving [[Jaihabar]] did not lead to a significant decline or flattening, as a large part of the population was evacuated. The Jaihabars found their new homes mainly in Korhalistan. | |||
=== 1740 - 1750 AN === | |||
During this decade, the Empire experienced stability and tranquillity. The economic situation recovered after the [[Recession of 1737|recession of 1737]] and prosperity increased. As a result, there was a slight slowdown in overall population growth. | |||
== Censuses == | == Censuses == | ||
[[Image:Demographic developments 1690- | [[Image:Demographic developments 1690-1750.png|thumb|right|Demographic developments 1690-1750]] | ||
A census is held every 10 Norton years, only in 1700 AN no census was held. The number for 1700 AN is estimated. | A census is held every 10 Norton years, only in 1700 AN no census was held. The number for 1700 AN is estimated. | ||
| Line 60: | Line 68: | ||
! 1730 | ! 1730 | ||
| 1,174,966,002 || {{increase}} 24% | | 1,174,966,002 || {{increase}} 24% | ||
|- | |||
! 1740 | |||
| 1,390,749,187 || {{increase}} 18% | |||
|- | |||
! 1750 | |||
| 1,580,782,031 || {{increase}} 14% | |||
|} | |} | ||
<small>''[1] This number is based on an estimate.''</small><br> | <small>''[1] This number is based on an estimate.''</small><br> | ||
| Line 67: | Line 81: | ||
=== By state === | === By state === | ||
{| class="wikitable" | {| class="wikitable" | ||
|- | |- | ||
! State !! colspan="2" style="text-align:center;" |1690 !! colspan="2" style="text-align:center;" |1710 !! colspan="2" style="text-align:center;" |1720 !! colspan="2" style="text-align:center;" |1730 | ! State !! colspan="2" style="text-align:center;" |1690 !! colspan="2" style="text-align:center;" |1710 !! colspan="2" style="text-align:center;" |1720 !! colspan="2" style="text-align:center;" |1730 !! colspan="2" style="text-align:center;" |1740 !! colspan="2" style="text-align:center;" |1750 | ||
|- style="text-align:center;" | |- style="text-align:center;" | ||
| | | | ||
|Population | |||
|Percentage | |||
|Population | |||
|Percentage | |||
|Population | |Population | ||
|Percentage | |Percentage | ||
| Line 92: | Line 108: | ||
|0.86% | |0.86% | ||
|9,522,218 | |9,522,218 | ||
|0.81% | |||
|11,236,217 | |||
|0.81% | |||
|12,809,287 | |||
|0.81% | |0.81% | ||
|- | |- | ||
| Line 103: | Line 123: | ||
|44,045 | |44,045 | ||
|0.0037% | |0.0037% | ||
|52,853 | |||
|0.0038% | |||
|53,382 | |||
|0.0034% | |||
|- | |- | ||
|[[Barikalus]] | |[[Barikalus]] | ||
| Line 112: | Line 136: | ||
|5.18% | |5.18% | ||
|57,295,193 | |57,295,193 | ||
|4.88% | |||
|67,608,328 | |||
|4.86% | |||
|77,073,494 | |||
|4.88% | |4.88% | ||
|- | |- | ||
| Line 123: | Line 151: | ||
|922,810 | |922,810 | ||
|0.08% | |0.08% | ||
|959,723 | |||
|0.07% | |||
|978,917 | |||
|0.06% | |||
|- | |- | ||
|[[Bulqan]] | |[[Bulqan]] | ||
| Line 133: | Line 165: | ||
|40,314,465 | |40,314,465 | ||
|3.43% | |3.43% | ||
|46,764,780 | |||
|3.36% | |||
|52,376,553 | |||
|3.31% | |||
|- | |- | ||
|[[Haritdesh]] | |[[Haritdesh]] | ||
| Line 143: | Line 179: | ||
|676,550,563 | |676,550,563 | ||
|57.58% | |57.58% | ||
|805,095,170 | |||
|57.89% | |||
|909,757,542 | |||
|57.55% | |||
|- | |- | ||
|[[Jaguda]] | |[[Jaguda]] | ||
| Line 152: | Line 192: | ||
|0.11% | |0.11% | ||
|1,194,270 | |1,194,270 | ||
|0.10% | |||
|1,421,181 | |||
|0.10% | |||
|1,634,359 | |||
|0.10% | |0.10% | ||
|- | |- | ||
| Line 163: | Line 207: | ||
|2,609,323 | |2,609,323 | ||
|0.22% | |0.22% | ||
| | |||
| | |||
| | |||
| | |||
|- | |- | ||
|[[Kadim]] | |[[Kadim]] | ||
| Line 173: | Line 221: | ||
|1,114,860 | |1,114,860 | ||
|0.22% | |0.22% | ||
|1,326,683 | |||
|0.10% | |||
|1,525,686 | |||
|0.10% | |||
|- | |- | ||
|[[Kantisha and Northak Islands]] | |[[Kantisha and Northak Islands]] | ||
| Line 182: | Line 234: | ||
|0.05% | |0.05% | ||
|560,332 | |560,332 | ||
|0.05% | |||
|666,795 | |||
|0.05% | |||
|766,815 | |||
|0.05% | |0.05% | ||
|- | |- | ||
| Line 193: | Line 249: | ||
|83,089,501 | |83,089,501 | ||
|7.07% | |7.07% | ||
|98,876,507 | |||
|7.11% | |||
|113,707,983 | |||
|7.19% | |||
|- | |- | ||
|[[Korhalistan]] | |[[Korhalistan]] | ||
| Line 203: | Line 263: | ||
|89,254,052 | |89,254,052 | ||
|7.6% | |7.6% | ||
|107,997,403 | |||
|7.77% | |||
|126,356,961 | |||
|7.99% | |||
|- | |- | ||
|[[Kyazilkai]] | |[[Kyazilkai]] | ||
| Line 213: | Line 277: | ||
|6,257,474 | |6,257,474 | ||
|0.53% | |0.53% | ||
|7,446,394 | |||
|0.54% | |||
|8,563,353 | |||
|0.54% | |||
|- | |- | ||
|[[Leyl]] | |[[Leyl Catologian State]] | ||
|250,026 | |250,026 | ||
|0.06% | |0.06% | ||
| Line 222: | Line 290: | ||
|0.05% | |0.05% | ||
|601,836 | |601,836 | ||
|0.05% | |||
|716,185 | |||
|0.05% | |||
|823,613 | |||
|0.05% | |0.05% | ||
|- | |- | ||
| Line 232: | Line 304: | ||
|0.02% | |0.02% | ||
|171,537 | |171,537 | ||
|0.01% | |||
|190,406 | |||
|0.01% | |||
|203,735 | |||
|0.01% | |0.01% | ||
|- | |- | ||
| Line 242: | Line 318: | ||
|0.02% | |0.02% | ||
|176,453 | |176,453 | ||
|0.02% | |||
|207,686 | |||
|0.02% | |||
|238,838 | |||
|0.02% | |0.02% | ||
|- | |- | ||
| Line 252: | Line 332: | ||
|0.36% | |0.36% | ||
|3,980,900 | |3,980,900 | ||
|0.34% | |||
|4,737,271 | |||
|0.34% | |||
|5,447,862 | |||
|0.34% | |0.34% | ||
|- | |- | ||
| Line 262: | Line 346: | ||
|0.00045% | |0.00045% | ||
|4,792 | |4,792 | ||
|0.00041 | |0.00041% | ||
|5,641 | |||
|0.00041% | |||
|6,487 | |||
|0.00041% | |||
|- | |- | ||
|[[Pathaardesh]] | |[[Pathaardesh]] | ||
| Line 273: | Line 361: | ||
|14,955,134 | |14,955,134 | ||
|1.27% | |1.27% | ||
|17,796,609 | |||
|1.28% | |||
|20,466,101 | |||
|1.29% | |||
|- | |- | ||
|[[Poorajangal]] | |[[Poorajangal]] | ||
| Line 283: | Line 375: | ||
|51,501,813 | |51,501,813 | ||
|4.38% | |4.38% | ||
|61,287,157 | |||
|4.41% | |||
|70,480,231 | |||
|4.46% | |||
|- | |- | ||
|[[Sikatadesh]] | |[[Sikatadesh]] | ||
| Line 293: | Line 389: | ||
|36,765,016 | |36,765,016 | ||
|3.13% | |3.13% | ||
|43,750,369 | |||
|3.15% | |||
|50,312,924 | |||
|3.18% | |||
|- | |- | ||
|[[Sri Pashana]] | |[[Sri Pashana]] | ||
| Line 303: | Line 403: | ||
|42,755,443 | |42,755,443 | ||
|3.64% | |3.64% | ||
|47,030,987 | |||
|3.38% | |||
|51,734,086 | |||
|3.27% | |||
|- | |- | ||
|[[Sunehra]] | |[[Sunehra]] | ||
| Line 313: | Line 417: | ||
|29,412,013 | |29,412,013 | ||
|2.5% | |2.5% | ||
|35,000,295 | |||
|2.52% | |||
|40,250,339 | |||
|2.55% | |||
|- | |- | ||
|[[Suqutra]] | |[[Suqutra]] | ||
| Line 322: | Line 430: | ||
|0.003% | |0.003% | ||
|32,266 | |32,266 | ||
|0.003% | |||
|37,977 | |||
|0.003% | |||
|43,673 | |||
|0.003% | |0.003% | ||
|- | |- | ||
| Line 333: | Line 445: | ||
|17,837,872 | |17,837,872 | ||
|1.52% | |1.52% | ||
|20,995,176 | |||
|1.51% | |||
|24,144,452 | |||
|1.53% | |||
|- | |- | ||
|[[Tartaristan]] | |[[Tartaristan]] | ||
| Line 343: | Line 459: | ||
|5,790,270 | |5,790,270 | ||
|0.49% | |0.49% | ||
|6,815,147 | |||
|0.49% | |||
|7,837,419 | |||
|0.50% | |||
|- | |- | ||
|[[Tennyn]] | |[[Tennyn]] | ||
| Line 352: | Line 472: | ||
|0.01% | |0.01% | ||
|75,185 | |75,185 | ||
|0.01% | |||
|88,492 | |||
|0.01% | |||
|101,766 | |||
|0.01% | |0.01% | ||
|- | |- | ||
| Line 362: | Line 486: | ||
|0.06% | |0.06% | ||
|716,703 | |716,703 | ||
|0.06% | |||
|868,644 | |||
|0.06% | |||
|1,016,314 | |||
|0.06% | |0.06% | ||
|- | |- | ||
| Line 373: | Line 501: | ||
|1,459,663 | |1,459,663 | ||
|0.12% | |0.12% | ||
|1,769,112 | |||
|0.13% | |||
|2,069,861 | |||
|0.13% | |||
|} | |} | ||
<small>''[5] This number is based on an estimate.''</small><br> | <small>''[5] This number is based on an estimate.''</small><br> | ||
<small>''[6] Counted at the mid-term census of 1724 AN.''</small> | <small>''[6] Counted at the mid-term census of 1724 AN.''</small> | ||
<gallery widths="250" heights="150"> | |||
Image:Census1710.png|1710 AN | |||
Image:Census1720.png|1720 AN | |||
Image:Census1730.png|1730 AN | |||
Image:Census1740.png|1740 AN | |||
Image:Census1750.png|1750 AN | |||
</gallery> | |||
=== By ethnicity === | === By ethnicity === | ||
The 1720 census also recorded ethnicity for the first time. | The 1720 census also recorded ethnicity for the first time. | ||
{| class="wikitable" | {| class="wikitable" | ||
|- | |- | ||
! Ethnicity !! colspan="2" style="text-align:center;" |1720 !! colspan="2" style="text-align:center;" |1730 | ! Ethnicity !! colspan="2" style="text-align:center;" |1720 !! colspan="2" style="text-align:center;" |1730 !! colspan="2" style="text-align:center;" |1740 !! colspan="2" style="text-align:center;" |1750 | ||
|- style="text-align:center;" | |- style="text-align:center;" | ||
| | | | ||
|Population | |||
|Percentage | |||
|Population | |||
|Percentage | |||
|Population | |Population | ||
|Percentage | |Percentage | ||
| Line 396: | Line 539: | ||
|74.43% | |74.43% | ||
|844,362,069 | |844,362,069 | ||
| | |71.86% | ||
|1,004,417,397 | |||
|72.22% | |||
|1,141,319,901 | |||
|82.97% | |||
|- | |- | ||
|Alukustani | |Alukustani | ||
| Line 402: | Line 549: | ||
|1.10% | |1.10% | ||
|12,470,139 | |12,470,139 | ||
|1. | |1.06% | ||
|14,839,466 | |||
|1.07% | |||
|16,816,740 | |||
|1.21% | |||
|- | |- | ||
|Arborish | |Arborish | ||
| Line 408: | Line 559: | ||
|7.52% | |7.52% | ||
|83,704,387 | |83,704,387 | ||
|7. | |7.12% | ||
|98,996,047 | |||
|7.12% | |||
|112,948,272 | |||
|8.12% | |||
|- | |- | ||
|Babkhi | |Babkhi | ||
| Line 414: | Line 569: | ||
|2.25% | |2.25% | ||
|25,363,713 | |25,363,713 | ||
|2. | |2.16% | ||
|30,461,641 | |||
|2.19% | |||
|35,201,108 | |||
|2.53% | |||
|- | |- | ||
| | |Batavian | ||
|6,834,818 | |6,834,818 | ||
|0.75% | |0.75% | ||
|9,431,838 | |9,431,838 | ||
|0. | |0.80% | ||
|11,083,561 | |||
|0.80% | |||
|12,444,756 | |||
|0.89% | |||
|- | |- | ||
|Franks | |Franks | ||
| Line 426: | Line 589: | ||
|0.16% | |0.16% | ||
|1,718,856 | |1,718,856 | ||
|0. | |0.15% | ||
|2,028,250 | |||
|0.15% | |||
|2,312,205 | |||
|0.17% | |||
|- | |- | ||
|Guwahat | |Guwahat | ||
| Line 432: | Line 599: | ||
|0.002% | |0.002% | ||
|42,774,487 | |42,774,487 | ||
| | |3.64% | ||
|47,053,459 | |||
|3.38% | |||
|51,759,704 | |||
|3.72% | |||
|- | |- | ||
|Hasna | |Hasna | ||
| Line 438: | Line 609: | ||
|4.03% | |4.03% | ||
|44,890,542 | |44,890,542 | ||
|4. | |3.82% | ||
|53,284,435 | |||
|3.83% | |||
|61,277,101 | |||
|4.41% | |||
|- | |||
|Jaihabars <sup>[7]</sup> | |||
| | |||
| | |||
|2,609,323 | |||
|0.22% | |||
|1,619,961 | |||
|0.12% | |||
|1,895,354 | |||
|0.14% | |||
|- | |- | ||
|Jing/Kildarians | |Jing/Kildarians | ||
| Line 444: | Line 629: | ||
|0.29% | |0.29% | ||
|3,257,046 | |3,257,046 | ||
|0. | |0.28% | ||
|3,881,551 | |||
|0.28% | |||
|4,473,372 | |||
|0.32% | |||
|- | |- | ||
|Kantic | |Kantic | ||
| Line 450: | Line 639: | ||
|0.02% | |0.02% | ||
|179,306 | |179,306 | ||
|0.02% | |||
|213,375 | |||
|0.02% | |||
|245,381 | |||
|0.02% | |0.02% | ||
|- | |- | ||
| Line 456: | Line 649: | ||
|5.15% | |5.15% | ||
|56,315,461 | |56,315,461 | ||
|5. | |4.79% | ||
|66,032,909 | |||
|4.75% | |||
|74,800,726 | |||
|5.38% | |||
|- | |- | ||
|Kyazili | |Kyazili | ||
| Line 462: | Line 659: | ||
|0.64% | |0.64% | ||
|6,972,002 | |6,972,002 | ||
|0. | |0.59% | ||
|8,319,249 | |||
|0.60% | |||
|9,590,424 | |||
|0.69% | |||
|- | |- | ||
|Nogans | |Nogans | ||
| Line 468: | Line 669: | ||
|1.27% | |1.27% | ||
|14,020,095 | |14,020,095 | ||
|1. | |1.19% | ||
|16,598,866 | |||
|1.19% | |||
|19,088,696 | |||
|1.37% | |||
|- | |- | ||
|Sanpo | |Sanpo | ||
| Line 475: | Line 680: | ||
|261,796 | |261,796 | ||
|0.02% | |0.02% | ||
|308,705 | |||
|0.02% | |||
|352,764 | |||
|0.03% | |||
|- | |- | ||
|Sennari | |Sennari | ||
| Line 480: | Line 689: | ||
|0.55% | |0.55% | ||
|6,286,744 | |6,286,744 | ||
|0. | |0.54% | ||
|7,481,225 | |||
|0.54% | |||
|8,523,785 | |||
|0.61% | |||
|- | |- | ||
|Taka'atu | |Taka'atu | ||
| Line 486: | Line 699: | ||
|0.51% | |0.51% | ||
|5,505,549 | |5,505,549 | ||
|0. | |0.47% | ||
|6,480,031 | |||
|0.47% | |||
|7,452,035 | |||
|0.54% | |||
|- | |- | ||
|Tartari | |Tartari | ||
| Line 492: | Line 709: | ||
|1.17% | |1.17% | ||
|13,294,040 | |13,294,040 | ||
|1. | |1.13% | ||
|15,819,996 | |||
|1.14% | |||
|18,191,515 | |||
|1.31% | |||
|- | |- | ||
|Thraci | |Thraci | ||
| Line 499: | Line 720: | ||
|1,377,072 | |1,377,072 | ||
|0.12% | |0.12% | ||
|1,638,658 | |||
|0.12% | |||
|1,884,457 | |||
|0.14% | |||
|} | |} | ||
<small>''[7] Since 1721 AN, this ethnicity has been recognised as distinctive.''</small><br> | |||
<gallery widths="250" heights="150"> | |||
Image:Etnicity1720.png|1720 AN | |||
Image:Etnicity1730.png|1730 AN | |||
Image:Etnicity1740.png|1740 AN | |||
Image:Etnicity1750.png|1750 AN | |||
</gallery> | |||
=== By Language === | === By Language === | ||
The 1720 census also recorded language for the first time. | The 1720 census also recorded language for the first time. | ||
{| class="wikitable" | {| class="wikitable" | ||
|- | |- | ||
! Religion !! colspan="2" style="text-align:center;" |1720 !! colspan="2" style="text-align:center;" |1730 | ! Religion !! colspan="2" style="text-align:center;" |1720 !! colspan="2" style="text-align:center;" |1730 !! colspan="2" style="text-align:center;" |1740 !! colspan="2" style="text-align:center;" |1750 | ||
|- style="text-align:center;" | |- style="text-align:center;" | ||
| | | | ||
|Population | |||
|Percentage | |||
|Population | |||
|Percentage | |||
|Population | |Population | ||
|Percentage | |Percentage | ||
| Line 521: | Line 757: | ||
|844,362,069 | |844,362,069 | ||
|71.86% | |71.86% | ||
|1,004,417,397 | |||
|72.22% | |||
|1,141,319,901 | |||
|72.20% | |||
|- | |- | ||
|Arboric | |Arboric | ||
| Line 527: | Line 767: | ||
|115,755,311 | |115,755,311 | ||
|9.85% | |9.85% | ||
|137,136,734 | |||
|9.86% | |||
|156,480,313 | |||
|9.90% | |||
|- | |- | ||
|Babkhi | |Babkhi | ||
| Line 533: | Line 777: | ||
|25,363,713 | |25,363,713 | ||
|2.16% | |2.16% | ||
|30,461,641 | |||
|2.19% | |||
|35,201,108 | |||
|2.23% | |||
|- | |- | ||
|Batavian | |Batavian (Badaweians) | ||
|6,834,818 | |6,834,818 | ||
|0.75% | |0.75% | ||
|9,431,838 | |9,431,838 | ||
|0.8% | |0.8% | ||
|11,083,561 | |||
|0.80% | |||
|12,444,756 | |||
|0.79% | |||
|- | |- | ||
|[[Istvanistani language|Common Tongue]] <sup>[ | |[[Istvanistani language|Common Tongue]] <sup>[8]</sup> | ||
|5,742,060 | |5,742,060 | ||
|0.63% | |0.63% | ||
|6,808,367 | |6,808,367 | ||
|0.58% | |||
|8,032,651 | |||
|0.58% | |||
|9,241,348 | |||
|0.58% | |0.58% | ||
|- | |- | ||
| Line 551: | Line 807: | ||
|1,718,856 | |1,718,856 | ||
|0.15% | |0.15% | ||
|2,028,250 | |||
|0.15% | |||
|2,312,205 | |||
|0.15% | |||
|- | |||
|Jaihalam <sup>[9]</sup> | |||
| | |||
| | |||
|2,609,323 | |||
|0.22% | |||
|1,619,961 | |||
|0.12% | |||
|1,895,354 | |||
|0.12% | |||
|- | |- | ||
|Jingdaoese | |Jingdaoese | ||
| Line 556: | Line 826: | ||
|0.18% | |0.18% | ||
|1,954,228 | |1,954,228 | ||
|0.17% | |||
|2,328,930 | |||
|0.17% | |||
|2,684,023 | |||
|0.17% | |0.17% | ||
|- | |- | ||
| Line 562: | Line 836: | ||
|0.02% | |0.02% | ||
|179,306 | |179,306 | ||
|0.02% | |||
|213,375 | |||
|0.02% | |||
|245,381 | |||
|0.02% | |0.02% | ||
|- | |- | ||
|Krasnocorian | |Koriya (Krasnocorian) | ||
|46,845,080 | |46,845,080 | ||
|5.15% | |5.15% | ||
|56,315,416 | |56,315,416 | ||
|4.79% | |4.79% | ||
|66,032,909 | |||
|4.75% | |||
|74,800,726 | |||
|4.73% | |||
|- | |- | ||
|Qyzylqay | |Qyzylqay | ||
| Line 575: | Line 857: | ||
|6,972,002 | |6,972,002 | ||
|0.59% | |0.59% | ||
|8,319,249 | |||
|0.60% | |||
|9,590,424 | |||
|0.61% | |||
|- | |- | ||
|[[Samsrumukhat]] | |[[Samsrumukhat]] | ||
| Line 581: | Line 867: | ||
|42,774,487 | |42,774,487 | ||
|3.64% | |3.64% | ||
|47,053,459 | |||
|3.38% | |||
|51,759,704 | |||
|3.27% | |||
|- | |- | ||
|Sanpanese | |Sanpanese | ||
| Line 586: | Line 876: | ||
|0.02% | |0.02% | ||
|261,796 | |261,796 | ||
|0.02% | |||
|308,705 | |||
|0.02% | |||
|352,764 | |||
|0.02% | |0.02% | ||
|- | |- | ||
| Line 593: | Line 887: | ||
|60,287,709 | |60,287,709 | ||
|5.13% | |5.13% | ||
|71,521,960 | |||
|5.14% | |||
|82,250,254 | |||
|5.20% | |||
|} | |} | ||
<small>''[ | <small>''[8] The Common Tongue is widely spoken, taught in schools and is the administrative language. Counted here as a mother tongue.''<br>''[9] Since 1721 AN, this language has been officially recognised.''</small> | ||
<gallery widths="250" heights="150"> | |||
Image:Lang1720.png|1720 AN | |||
Image:Lang1730.png|1730 AN | |||
Image:Lang1740.png|1740 AN | |||
Image:Lang1750.png|1750 AN | |||
</gallery> | |||
=== By religion === | === By religion === | ||
The 1720 census also recorded religion for the first time. Only this was not mandatory, so those people who did not declare their religion are listed as "irreligious". Which does not mean these people are atheists, as many consider their religion private which a state does not need to know. | The 1720 census also recorded religion for the first time. Only this was not mandatory, so those people who did not declare their religion are listed as "irreligious". Which does not mean these people are atheists, as many consider their religion private which a state does not need to know. | ||
{| class="wikitable" | {| class="wikitable" | ||
|- | |- | ||
! Religion !! colspan="2" style="text-align:center;" |1720 !! colspan="2" style="text-align:center;" |1730 | ! Religion !! colspan="2" style="text-align:center;" |1720 !! colspan="2" style="text-align:center;" |1730 !! colspan="2" style="text-align:center;" |1740 !! colspan="2" style="text-align:center;" |1750 | ||
|- style="text-align:center;" | |- style="text-align:center;" | ||
| | | | ||
|Population | |||
|Percentage | |||
|Population | |||
|Percentage | |||
|Population | |Population | ||
|Percentage | |Percentage | ||
| Line 616: | Line 924: | ||
|9,863,738 | |9,863,738 | ||
|0.84% | |0.84% | ||
|11,597,804 | |||
|0.83% | |||
|13,050,044 | |||
|0.83% | |||
|- | |- | ||
|[[Cedrism]] | |[[Cedrism]] | ||
| Line 621: | Line 933: | ||
|0.29% | |0.29% | ||
|3,257,046 | |3,257,046 | ||
|0.28% | |||
|3,881,551 | |||
|0.28% | |||
|4,473,372 | |||
|0.28% | |0.28% | ||
|- | |- | ||
| Line 628: | Line 944: | ||
|877,748,315 | |877,748,315 | ||
|74.7% | |74.7% | ||
|1,040,848,105 | |||
|74.84% | |||
|1,182,769,849 | |||
|74.82% | |||
|- | |- | ||
|[[Nazarene]] | |[[Nazarene]] | ||
| Line 634: | Line 954: | ||
|59,014,387 | |59,014,387 | ||
|5.02% | |5.02% | ||
|69,478,160 | |||
|5.00% | |||
|78,790,402 | |||
|4.98% | |||
|- | |- | ||
|[[Zurvanism]] | |[[Zurvanism]] | ||
| Line 640: | Line 964: | ||
|29,269,079 | |29,269,079 | ||
|2.49% | |2.49% | ||
|35,026,200 | |||
|2.52% | |||
|40,416,307 | |||
|2.56% | |||
|- | |- | ||
|Irreligious | |Irreligious | ||
| Line 646: | Line 974: | ||
|195,813,437 | |195,813,437 | ||
|16.67% | |16.67% | ||
|229,917,368 | |||
|16.53% | |||
|261,282,057 | |||
|16.53% | |||
|} | |} | ||
<gallery widths="250" heights="150"> | |||
Image:Religion1720.png|1720 AN | |||
Image:Religion1730.png|1730 AN | |||
Image:Religion1740.png|1740 AN | |||
Image:Religion1750.png|1750 AN | |||
</gallery> | |||
{{Çakaristan nav}} | {{Çakaristan nav}} | ||
[[Category:Demographics]] | |||
Latest revision as of 16:40, 13 December 2025
Çakaristan is the most populous country on Micras. The last census of Shireroth showed that Çakaristan its neighbour had surpassed in population.
A census is conducted every 10 Norton years, this is used to determine the number of seats in the Majlis al-Nuwaab. The last census was in 1750 AN.
Between 1690 and 1711 AN, population growth was mainly due to the growth of Çakaristan. More and more territory with its population came under the Çakar flag. The exception is the period of the Great Apollonian Empire, between 1698 and 1704, during which the population is estimated at more than one billion. In the 1720 census, Beneluccas and Sri Pashana could not be counted due to the Sanpo-Çakar War. In view of the 1725 elections, a mid-term census was held in those states in 1724 AN. As well as in the new states of Jaihabar, Lija and Sanpantul. Since then, relative peace has prevailed, increasing the population size at the 1740 census and the 1750 census.
Population developments
Up to 1690 AN

In the area west of the Green Border, particularly Haritdesh, there are two benchmarks. In 1619 AN it was stated that Aryasht at that time had around 300 million inhabitants. [1] And the second benchmark is this census. In the intervening period there have been several developments, initially increasing the population to just under 700,500,000. After that, a decline started, as a result of statelessness. There were no major wars in the area, as well as pandemics, such as the Alexandrian Flu.
There is no history of large-scale migration. However, after the foundation of Çakaristan, migration began, with large groups migrating to the east, especially to the areas Poorajangal and Korhalistan. Migration to the Sylfystan region was mainly limited to the new capital Agra. The construction of this city offered the most opportunities for the migrants.
Due to the lack of exact data between the two benchmarks, 1619 and 1690 AN, the progress has been modelled.
1690 - 1698 AN
Between 1690 and 1698 AN, Çakaristan was expanded to include the former Coria and Sri Pashana. Together with natural growth, this created an estimated population of 550,405,460. In 1698 AN, Çakaristan merged with Jingdao to form the Great Apollonian Empire. It was estimated that Jingdao had a population of 501,860,000. The Great Apollonian Empire was the first nation on Micras to reach the 1 billion mark. After the fall of that empire, this marker was achieved by Shireroth in 1715 AN. In this, Kildare had the biggest contribution, a former part of the Great Apollonian Empire.
1698 - 1710 AN
For Çakaristan, the fall of the Great Apollonian Empire did not cause many casualties. In the areas that remained under the Çakar flag, there was relative peace. The 1710 census had counted a growth of 86% over the 1690 census. This growth is only partly due to natural growth. Mainly the addition of territories, such as Barikalus and Qyzylqaystan, have contributed to the growth.
1710 - 1720 AN
Population growth levelled off slightly in the period from 1710 to 1720 AN. During this period, the Empire did expand, but less spectacularly than before 1710 AN. Expansions took place in the Norfolk Isles, the Skerry Isles and the Oceanic Territory. In the Skerry Isles, the Sanpo-Çakar War raged between 1716 and 1720 AN, reducing the population size.
1720 - 1730 AN
The decade has seen steady population growth. This is due to an end to the Sanpo-Çakar War and relative peace. The numbers over the total would have been higher if Sanpantul had remained a princely state, but given that the state continued as an unincorporated territory, not included in the 1730 census. The Jaihabars were recognised in 1721 AN as a distinct ethnicity and separate population group with their own language, Jaihalam, which was also officially recognised.
In this decade, only a former island of Lostisland was added to the Empire. The number of casualties of the Great Skerry-Valencian Drought (1720-1728), which affected Beneluccas, Lija and Sri Pashana, was fortunately not as high.
1730 - 1740 AN
Again, the population grew steadily in the last decade. The growth is mainly natural increase, as no areas were added to the empire. Hrithik's rebellion took place in the relatively sparsely populated Tartaristan, so civilian casualties were not too high. Leaving Jaihabar did not lead to a significant decline or flattening, as a large part of the population was evacuated. The Jaihabars found their new homes mainly in Korhalistan.
1740 - 1750 AN
During this decade, the Empire experienced stability and tranquillity. The economic situation recovered after the recession of 1737 and prosperity increased. As a result, there was a slight slowdown in overall population growth.
Censuses

A census is held every 10 Norton years, only in 1700 AN no census was held. The number for 1700 AN is estimated.
| Year | Population | Development |
|---|---|---|
| 1690 | 411,398,684 | |
| 1700 [1] | 580,134,175 | ▲ 41% |
| 1710 [2] | 767,422,013 | ▲ 32% |
| 1720 [3] | 909,798,574 | ▲ 19% |
| 1724 [4] | 947,960,256 | ▲ 4% |
| 1730 | 1,174,966,002 | ▲ 24% |
| 1740 | 1,390,749,187 | ▲ 18% |
| 1750 | 1,580,782,031 | ▲ 14% |
[1] This number is based on an estimate.
[2] This is based on the census with addition of estimation of the recently added territories.
[3] The census could not be held in Beneluccas and Sri Pashana.
[4] The summation of the 1720 census and the mid-term census held in Beneluccas, Jaihabar, Lija, Sanpantul and Sri Pashana.
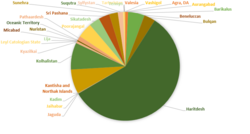
By state
| State | 1690 | 1710 | 1720 | 1730 | 1740 | 1750 | ||||||
|---|---|---|---|---|---|---|---|---|---|---|---|---|
| Population | Percentage | Population | Percentage | Population | Percentage | Population | Percentage | Population | Percentage | Population | Percentage | |
| Agra | 6,439,779 | 0.84% | 7,830,771 | 0.86% | 9,522,218 | 0.81% | 11,236,217 | 0.81% | 12,809,287 | 0.81% | ||
| Aurangabad | 33,469 | 0.0037% | 44,045 | 0.0037% | 52,853 | 0.0038% | 53,382 | 0.0034% | ||||
| Barikalus | 38,748,156 | 5.05% | 47,117,757 | 5.18% | 57,295,193 | 4.88% | 67,608,328 | 4.86% | 77,073,494 | 4.88% | ||
| Beneluccas | 726,389 | 0.09% | 846,615 | 0.09% | 922,810 | 0.08% | 959,723 | 0.07% | 978,917 | 0.06% | ||
| Bulqan | 29,051,618 | 3.79% | 34,222,806 | 3.76% | 40,314,465 | 3.43% | 46,764,780 | 3.36% | 52,376,553 | 3.31% | ||
| Haritdesh | 310,646,785 | 76% | 434,381,268 | 56.60% | 542,107,823 | 59.59% | 676,550,563 | 57.58% | 805,095,170 | 57.89% | 909,757,542 | 57.55% |
| Jaguda | 811,673 [5] | 0.11% | 984,559 | 0.11% | 1,194,270 | 0.10% | 1,421,181 | 0.10% | 1,634,359 | 0.10% | ||
| Jaihabar | 2,372,112 [6] | 0.25% | 2,609,323 | 0.22% | ||||||||
| Kadim | 757,703 [5] | 0.10% | 919.093 | 0.10% | 1,114,860 | 0.22% | 1,326,683 | 0.10% | 1,525,686 | 0.10% | ||
| Kantisha and Northak Islands | 380,824 | 0.05% | 461,939 | 0.05% | 560,332 | 0.05% | 666,795 | 0.05% | 766,815 | 0.05% | ||
| Kendall Khanate | 34,553,116 | 8% | 54,179,882 | 7.06% | 67,061,744 | 7.37% | 83,089,501 | 7.07% | 98,876,507 | 7.11% | 113,707,983 | 7.19% |
| Korhalistan | 36,546,681 | 9% | 57,305,825 | 7.47% | 71,517,670 | 7.86% | 89,254,052 | 7.6% | 107,997,403 | 7.77% | 126,356,961 | 7.99% |
| Kyazilkai | 4,509,293 [5] | 0.59% | 5,311,947 | 0.58% | 6,257,474 | 0.53% | 7,446,394 | 0.54% | 8,563,353 | 0.54% | ||
| Leyl Catologian State | 250,026 | 0.06% | 392,045 | 0.05% | 485,744 | 0.05% | 601,836 | 0.05% | 716,185 | 0.05% | 823,613 | 0.05% |
| Lija | 153,158 [6] | 0.02% | 171,537 | 0.01% | 190,406 | 0.01% | 203,735 | 0.01% | ||||
| Micabad | 81,094 | 0.02% | 127,157 | 0.02% | 149,791 | 0.02% | 176,453 | 0.02% | 207,686 | 0.02% | 238,838 | 0.02% |
| Nuristan | 2,705,576 [5] | 0.35% | 3,281,863 | 0.36% | 3,980,900 | 0.34% | 4,737,271 | 0.34% | 5,447,862 | 0.34% | ||
| Oceanic territory | 3,454 [5] | 0.00045% | 4,068 | 0.00045% | 4,792 | 0.00041% | 5,641 | 0.00041% | 6,487 | 0.00041% | ||
| Pathaardesh | 9,741,990 | 1.27% | 12,070,326 | 0.36% | 14,955,134 | 1.27% | 17,796,609 | 1.28% | 20,466,101 | 1.29% | ||
| Poorajangal | 21,088,346 | 5% | 33,066,889 | 4.31% | 41,267,478 | 4.54% | 51,501,813 | 4.38% | 61,287,157 | 4.41% | 70,480,231 | 4.46% |
| Sikatadesh | 23,630,518 | 3,08% | 29,459,147 | 3.24% | 36,765,016 | 3.13% | 43,750,369 | 3.15% | 50,312,924 | 3.18% | ||
| Sri Pashana | 33,048,479 | 4.31% | 38,518,417 [6] | 4.06% | 42,755,443 | 3.64% | 47,030,987 | 3.38% | 51,734,086 | 3.27% | ||
| Sunehra | 18,884,069 | 2,46% | 23,567,318 | 2.59% | 29,412,013 | 2.5% | 35,000,295 | 2.52% | 40,250,339 | 2.55% | ||
| Suqutra | 18,536 | 0.004% | 23,252 | 0.003% | 27,390 | 0.003% | 32,266 | 0.003% | 37,977 | 0.003% | 43,673 | 0.003% |
| Sylfystan | 8,214,101 | 2% | 12,854,420 | 1.68% | 15,142,506 | 1.66% | 17,837,872 | 1.52% | 20,995,176 | 1.51% | 24,144,452 | 1.53% |
| Tartaristan | 4,172,614 | 0.54% | 4,915,339 | 0.54% | 5,790,270 | 0.49% | 6,815,147 | 0.49% | 7,837,419 | 0.50% | ||
| Tennyn | 63,824 | 0.01% | 75,185 | 0.01% | 88,492 | 0.01% | 101,766 | 0.01% | ||||
| Valesia | 487,100 | 0.06% | 590,852 | 0.06% | 716,703 | 0.06% | 868,644 | 0.06% | 1,016,314 | 0.06% | ||
| Vashigol | 992,044 [5] | 0.13% | 1,203,350 | 0.13% | 1,459,663 | 0.12% | 1,769,112 | 0.13% | 2,069,861 | 0.13% | ||
[5] This number is based on an estimate.
[6] Counted at the mid-term census of 1724 AN.
-
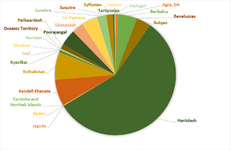 1710 AN
 -
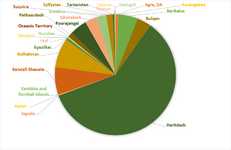 1720 AN
 -
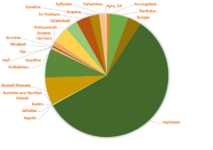 1730 AN
 -
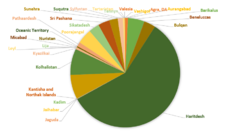 1740 AN
 -
 1750 AN


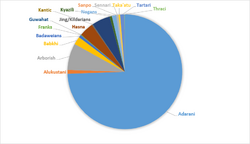
By ethnicity
The 1720 census also recorded ethnicity for the first time.
| Ethnicity | 1720 | 1730 | 1740 | 1750 | ||||
|---|---|---|---|---|---|---|---|---|
| Population | Percentage | Population | Percentage | Population | Percentage | Population | Percentage | |
| Adarani | 677,148,804 | 74.43% | 844,362,069 | 71.86% | 1,004,417,397 | 72.22% | 1,141,319,901 | 82.97% |
| Alukustani | 9,992,099 | 1.10% | 12,470,139 | 1.06% | 14,839,466 | 1.07% | 16,816,740 | 1.21% |
| Arborish | 68,447,559 | 7.52% | 83,704,387 | 7.12% | 98,996,047 | 7.12% | 112,948,272 | 8.12% |
| Babkhi | 20,429,415 | 2.25% | 25,363,713 | 2.16% | 30,461,641 | 2.19% | 35,201,108 | 2.53% |
| Batavian | 6,834,818 | 0.75% | 9,431,838 | 0.80% | 11,083,561 | 0.80% | 12,444,756 | 0.89% |
| Franks | 1,413,533 | 0.16% | 1,718,856 | 0.15% | 2,028,250 | 0.15% | 2,312,205 | 0.17% |
| Guwahat | 15,662 | 0.002% | 42,774,487 | 3.64% | 47,053,459 | 3.38% | 51,759,704 | 3.72% |
| Hasna | 36,666,276 | 4.03% | 44,890,542 | 3.82% | 53,284,435 | 3.83% | 61,277,101 | 4.41% |
| Jaihabars [7] | 2,609,323 | 0.22% | 1,619,961 | 0.12% | 1,895,354 | 0.14% | ||
| Jing/Kildarians | 2,671,047 | 0.29% | 3,257,046 | 0.28% | 3,881,551 | 0.28% | 4,473,372 | 0.32% |
| Kantic | 147,821 | 0.02% | 179,306 | 0.02% | 213,375 | 0.02% | 245,381 | 0.02% |
| Koriya | 46,845,080 | 5.15% | 56,315,461 | 4.79% | 66,032,909 | 4.75% | 74,800,726 | 5.38% |
| Kyazili | 5,864,418 | 0.64% | 6,972,002 | 0.59% | 8,319,249 | 0.60% | 9,590,424 | 0.69% |
| Nogans | 11,589,071 | 1.27% | 14,020,095 | 1.19% | 16,598,866 | 1.19% | 19,088,696 | 1.37% |
| Sanpo | 217,185 | 0.02% | 261,796 | 0.02% | 308,705 | 0.02% | 352,764 | 0.03% |
| Sennari | 5,037,455 | 0.55% | 6,286,744 | 0.54% | 7,481,225 | 0.54% | 8,523,785 | 0.61% |
| Taka'atu | 4,673,641 | 0.51% | 5,505,549 | 0.47% | 6,480,031 | 0.47% | 7,452,035 | 0.54% |
| Tartari | 10,669,320 | 1.17% | 13,294,040 | 1.13% | 15,819,996 | 1.14% | 18,191,515 | 1.31% |
| Thraci | 1,135,371 | 0.12% | 1,377,072 | 0.12% | 1,638,658 | 0.12% | 1,884,457 | 0.14% |
[7] Since 1721 AN, this ethnicity has been recognised as distinctive.
-
 1720 AN
 -
 1730 AN
 -
 1740 AN
 -
 1750 AN


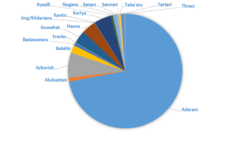
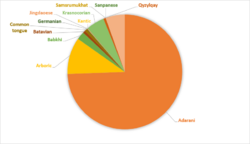
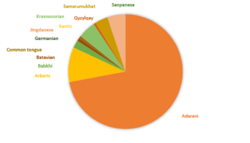
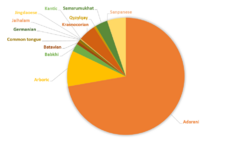
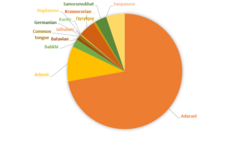
By Language
The 1720 census also recorded language for the first time.
| Religion | 1720 | 1730 | 1740 | 1750 | ||||
|---|---|---|---|---|---|---|---|---|
| Population | Percentage | Population | Percentage | Population | Percentage | Population | Percentage | |
| Adarani | 677,148,804 | 74.43% | 844,362,069 | 71.86% | 1,004,417,397 | 72.22% | 1,141,319,901 | 72.20% |
| Arboric | 94,146,433 | 10.35% | 115,755,311 | 9.85% | 137,136,734 | 9.86% | 156,480,313 | 9.90% |
| Babkhi | 20,429,415 | 2.25% | 25,363,713 | 2.16% | 30,461,641 | 2.19% | 35,201,108 | 2.23% |
| Batavian (Badaweians) | 6,834,818 | 0.75% | 9,431,838 | 0.8% | 11,083,561 | 0.80% | 12,444,756 | 0.79% |
| Common Tongue [8] | 5,742,060 | 0.63% | 6,808,367 | 0.58% | 8,032,651 | 0.58% | 9,241,348 | 0.58% |
| Germanian | 1,413,533 | 0.16% | 1,718,856 | 0.15% | 2,028,250 | 0.15% | 2,312,205 | 0.15% |
| Jaihalam [9] | 2,609,323 | 0.22% | 1,619,961 | 0.12% | 1,895,354 | 0.12% | ||
| Jingdaoese | 1,602,628 | 0.18% | 1,954,228 | 0.17% | 2,328,930 | 0.17% | 2,684,023 | 0.17% |
| Kantic | 147,821 | 0.02% | 179,306 | 0.02% | 213,375 | 0.02% | 245,381 | 0.02% |
| Koriya (Krasnocorian) | 46,845,080 | 5.15% | 56,315,416 | 4.79% | 66,032,909 | 4.75% | 74,800,726 | 4.73% |
| Qyzylqay | 5,864,418 | 0.64% | 6,972,002 | 0.59% | 8,319,249 | 0.60% | 9,590,424 | 0.61% |
| Samsrumukhat | 15,662 | 0.0017% | 42,774,487 | 3.64% | 47,053,459 | 3.38% | 51,759,704 | 3.27% |
| Sanpanese | 217,185 | 0.02% | 261,796 | 0.02% | 308,705 | 0.02% | 352,764 | 0.02% |
| Thraci | 49,390,718 | 5.43% | 60,287,709 | 5.13% | 71,521,960 | 5.14% | 82,250,254 | 5.20% |
[8] The Common Tongue is widely spoken, taught in schools and is the administrative language. Counted here as a mother tongue.
[9] Since 1721 AN, this language has been officially recognised.
-
 1720 AN
 -
 1730 AN
 -
 1740 AN
 -
 1750 AN


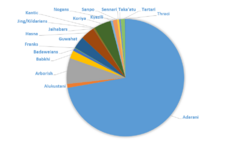
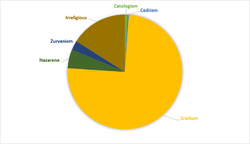
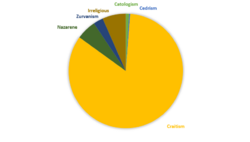
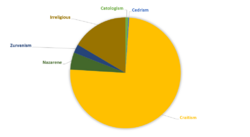
By religion
The 1720 census also recorded religion for the first time. Only this was not mandatory, so those people who did not declare their religion are listed as "irreligious". Which does not mean these people are atheists, as many consider their religion private which a state does not need to know.
| Religion | 1720 | 1730 | 1740 | 1750 | ||||
|---|---|---|---|---|---|---|---|---|
| Population | Percentage | Population | Percentage | Population | Percentage | Population | Percentage | |
| Catologism | 7,282,163 | 0.80% | 9,863,738 | 0.84% | 11,597,804 | 0.83% | 13,050,044 | 0.83% |
| Cedrism | 2,671,047 | 0.29% | 3,257,046 | 0.28% | 3,881,551 | 0.28% | 4,473,372 | 0.28% |
| Craitism | 681,771,920 | 74.94% | 877,748,315 | 74.7% | 1,040,848,105 | 74.84% | 1,182,769,849 | 74.82% |
| Nazarene | 48,629,201 | 5.35% | 59,014,387 | 5.02% | 69,478,160 | 5.00% | 78,790,402 | 4.98% |
| Zurvanism | 23,676,787 | 2.60% | 29,269,079 | 2.49% | 35,026,200 | 2.52% | 40,416,307 | 2.56% |
| Irreligious | 145,767,456 | 16.02% | 195,813,437 | 16.67% | 229,917,368 | 16.53% | 261,282,057 | 16.53% |
-
 1720 AN
 -
 1730 AN
 -
 1740 AN
 -
 1750 AN


| ||||||||||||||||||||||||||||||||||||||||||||||||||||||||||||||||||
