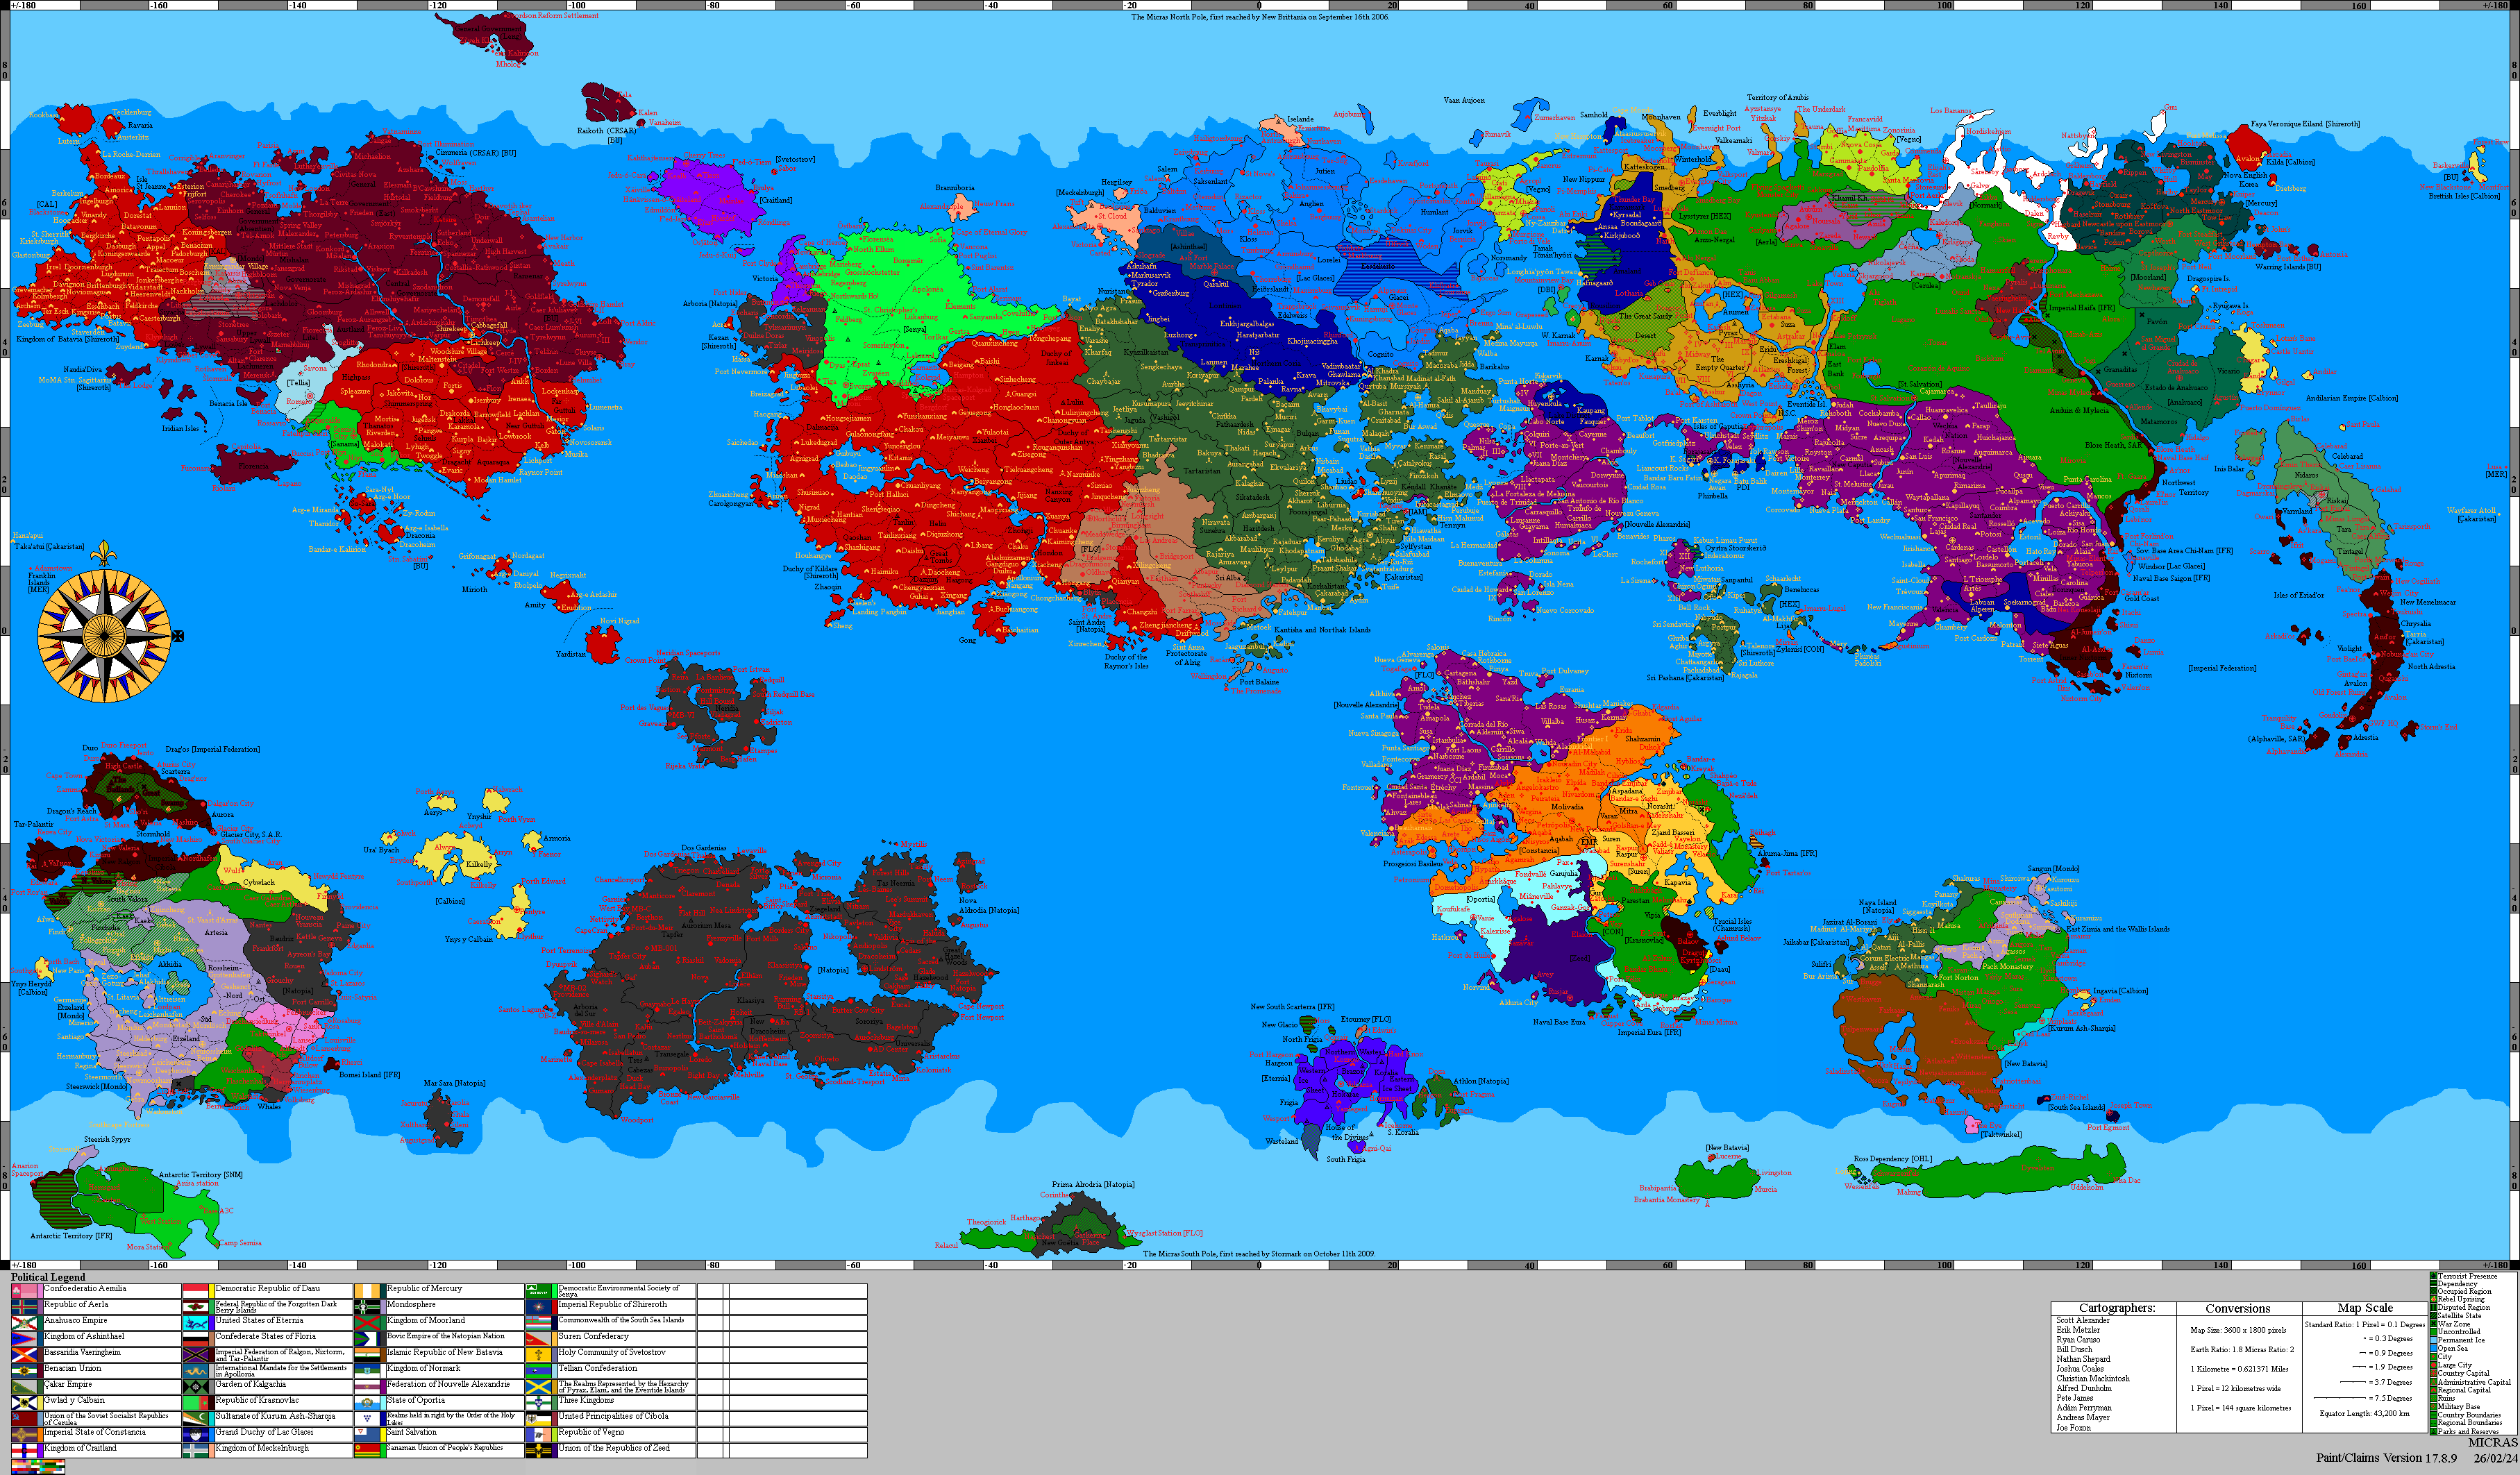
1747 Natopian census
| Bovic Empire of the Natopian Nation | |
| National Census | |
 | |
| General information | |
|---|---|
| Country |
 Natopia |
| Census date | 1747 AN |
| Administering authority |
Imperial Chancellery Ministry of Information Department of the Census |
| Demesnes enumerated |
22 (Whales withdrawn XV.1744 AN) |
| Results | |
| Total population | 1,028,153,708 |
| Change from prior census | ▲ +0.52% |
| Annual average growth | +0.13% |
| Prior census population | 1,022,808,059 (1743 AN) |
| Regional distribution | |
| Eastern Natopia |
483,952,327 (47.07%) |
| Western Natopia |
544,201,381 (52.93%) |
| Most populous demesne |
Ziegeland 125,064,461 (12.16%) |
| Least populous demesne |
Ptia 725,749 (0.07%) |
| Policy impact | |
| Frenzy apportionment | 1748 Natopian Frenzy election |
| Government at enumeration |
UDM–N&H coalition Chancellor Isabella Betancourt |
| Chronology | |
| Previous census | 1743 |
| Next census | 1751 |
| Demographics of Natopia | |

|
This article or section is a work in progress. The information below may be incomplete, outdated, or subject to change. |
The 1747 Natopian census was a demographic survey conducted by the Imperial Chancellery of Natopia's Ministry of Information through its Department of the Census. The census recorded a total population of 1,028,153,708 for the Bovic Empire of the Natopian Nation, reflecting a 0.52% increase from the previous census in 1743 AN.
The 1747 census was the first conducted following the withdrawal from Whales in XV.1744 AN, after Whales was ceded to the Aemilian Confederation via the Treaty of Sankt Rosa. Approximately 700,000 former Whales residents were absorbed as refugees into neighboring western demesnes, while an estimated 225,000 emigrated abroad or were casualties of the chaotic withdrawal.
Background
The period between the 1743 AN and 1747 AN censuses was marked by significant political and economic turbulence. The Free Juice and Bagels Party's victory in the 1742 AN election brought Emmanuel Aristarchus to the Chancellorship, whose isolationist "Natopia First" agenda led to the controversial Treaty of Sankt Rosa and the subsequent withdrawal from Whales in 1743 AN–1744 AN. Although the FBJP retained power in the 1744 AN election, a constructive vote of no confidence in 1745 AN brought the Union Democratic Movement to government in coalition with the Nationalist & Humanist Party, under Chancellor Isabella Betancourt.
The reduced population growth rate of 0.52% (compared to 0.67% in the prior period) reflected the political instability, economic disruption, and loss of the Whales demesne.
Methodology
Results
Total population
| Census Year | Total Population | Change from Prior Census | Annual Average Growth | Demesnes |
|---|---|---|---|---|
| 1739 AN | 1,015,969,469 | — | — | 23 |
| 1743 AN | 1,022,808,059 | +0.67% | +0.17% | 23 |
| 1747 AN | 1,028,153,708 | +0.52% | +0.13% | 22 |
Population by demesne
| Demesne | Population (1747 AN) | % of Total Population | Change from 1743 AN | Notes |
|---|---|---|---|---|
| Eastern Natopia | ||||
| Ziegeland | 125,064,461 | 12.16% | +0.44% | |
| Tas Neemia | 100,260,852 | 9.75% | +0.56% | |
| Nova Alrodria | 9,022,495 | 0.88% | +0.88% | |
| Hazelwood | 48,986,035 | 4.76% | +0.68% | |
| Lindstrom | 19,148,892 | 1.86% | +0.40% | |
| Sororiya | 52,956,902 | 5.15% | +0.76% | |
| Universalis | 32,619,041 | 3.17% | +0.28% | |
| Klaasiya | 83,891,993 | 8.16% | +0.52% | |
| New Dracoheim | 9,654,910 | 0.94% | +0.24% | |
| Ptia | 725,749 | 0.07% | +0.12% | |
| Athlon | 856,057 | 0.08% | +0.16% | |
| Naya Island | 764,940 | 0.07% | +0.20% | |
| Eastern Natopia Subtotal | 483,952,327 | 47.07% | ||
| Western Natopia | ||||
| Arboria | 58,187,903 | 5.66% | +1.30% | Includes ~400,000 Whales refugees |
| Dos Gardenias | 44,642,859 | 4.34% | +0.68% | |
| Tapfer | 109,845,652 | 10.69% | +0.61% | Includes ~50,000 Whales refugees |
| Baudrix | 77,596,666 | 7.55% | +0.52% | |
| Arboria del Sur | 50,515,348 | 4.91% | +0.64% | |
| Saint Andre | 39,785,622 | 3.87% | +1.27% | Includes ~200,000 Whales refugees |
| Transegale | 42,557,433 | 4.14% | +0.50% | Includes ~25,000 Whales refugees |
| Mar Sara | 18,043,116 | 1.75% | +0.36% | |
| Neridia | 99,512,663 | 9.68% | +0.51% | Includes ~25,000 Whales refugees |
| Geneva | 3,514,119 | 0.34% | +0.32% | |
| Western Natopia Subtotal | 544,201,381 | 52.93% | ||
| Total | 1,028,153,708 | 100.00% | +0.52% | |
Whales population disposition
The 1743 AN census recorded 927,330 residents in the demesne of Whales. Following the chaotic withdrawal in XV.1744 AN, this population was dispersed as follows:
| Disposition | Estimated Population | Percentage |
|---|---|---|
| Refugees absorbed into Arboria | ~400,000 | 43.1% |
| Refugees absorbed into Saint Andre | ~200,000 | 21.6% |
| Refugees absorbed into Tapfer | ~50,000 | 5.4% |
| Refugees absorbed into Transegale | ~25,000 | 2.7% |
| Refugees absorbed into Neridia | ~25,000 | 2.7% |
| Emigrated abroad or casualties | ~227,330 | 24.5% |
| Total | 927,330 | 100.0% |
Demographic breakdown
Age distribution
Gender distribution
Geographic distribution
Ethnic composition
Religious affiliation
Economic indicators
Employment rates
Income distribution
Education levels
Impact and policy implications
The 1747 census data was used to apportion seats in the Frenzy for the 1748 Natopian Frenzy election.
Criticisms and controversies
The methodology for counting Whales refugees drew criticism from some demesnial governments, who argued that the displaced population should be counted separately rather than incorporated into destination demesne totals. The Ministry of Information maintained that standard residency criteria applied regardless of origin.
See also
- 1743 Natopian census
- 1751 Natopian census
- Natopian Withdrawal from Whales
- Treaty of Sankt Rosa
- Demographics of Natopia
- Imperial Chancellery of Natopia