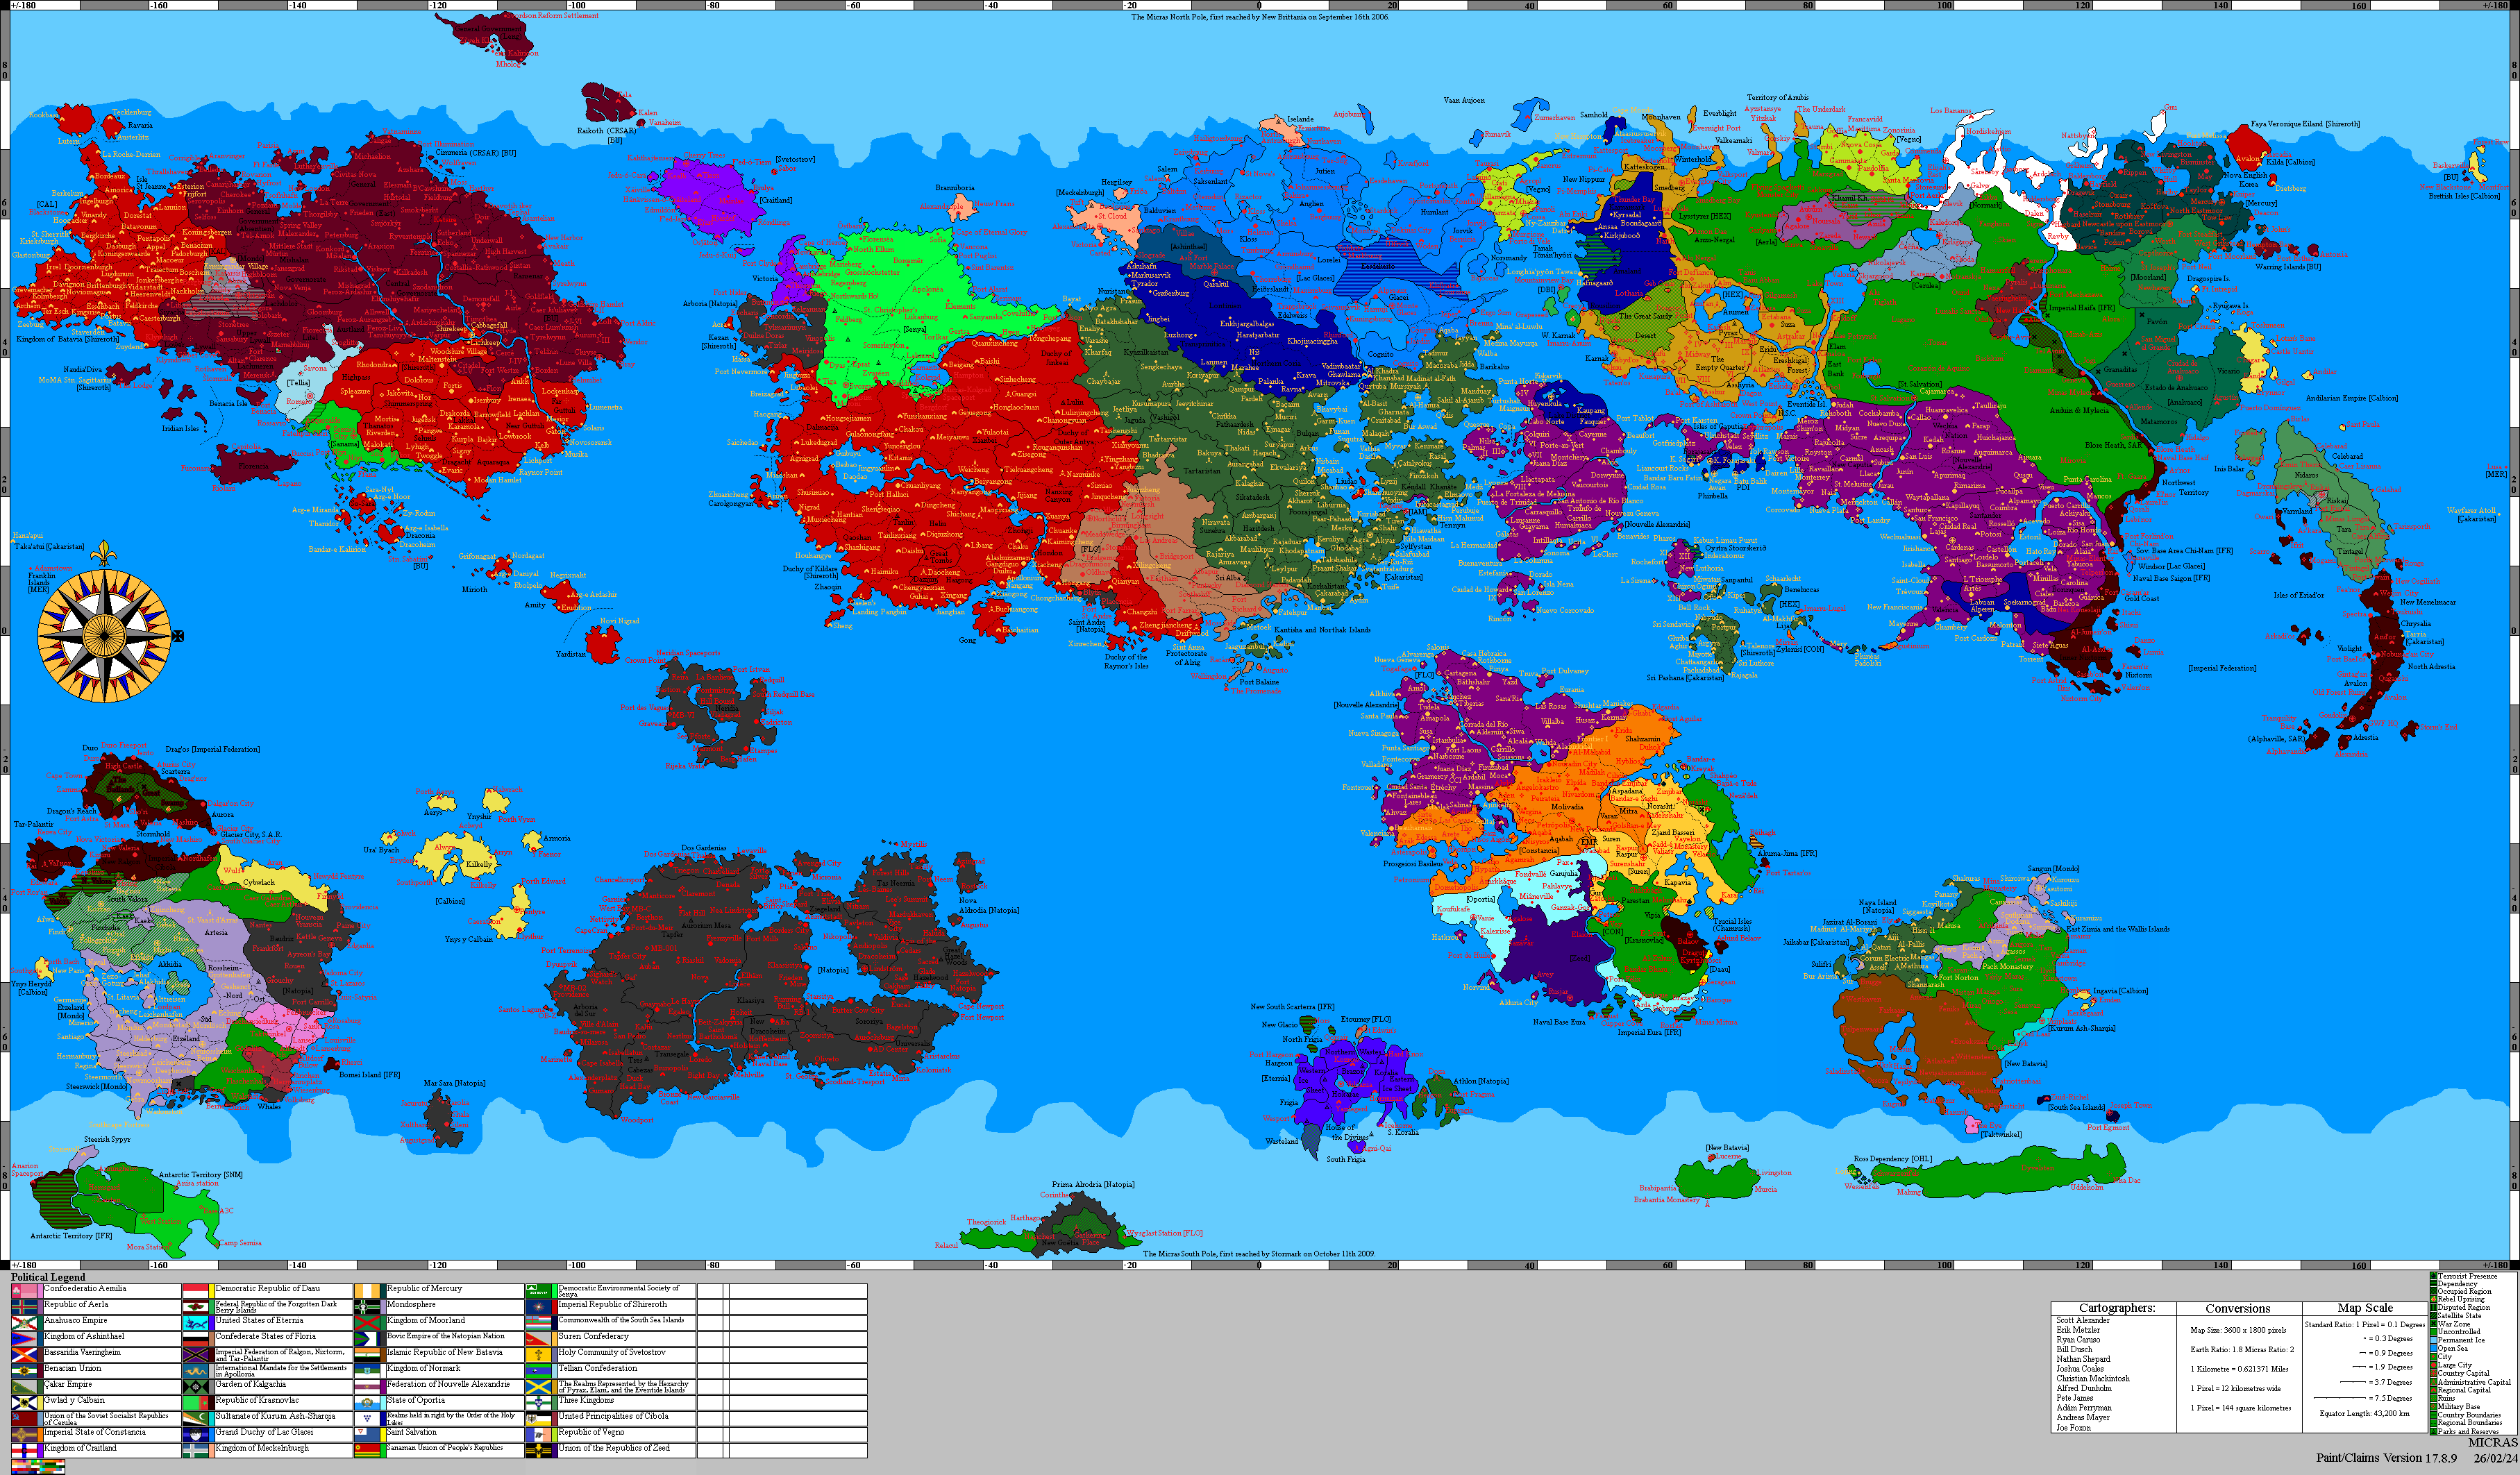
1743 Natopian census
From MicrasWiki
Jump to navigationJump to search
| Bovic Empire of the Natopian Nation | |
| National Census | |
 | |
| General information | |
|---|---|
| Country |
 Natopia |
| Census date | 1743 AN |
| Administering authority |
Imperial Chancellery Ministry of Information Department of the Census |
| Demesnes enumerated | 23 |
| Results | |
| Total population | 1,022,808,059 |
| Change from prior census | ▲ +0.67% |
| Annual average growth | +0.17% |
| Prior census population | 1,015,969,469 (1739 AN) |
| Regional distribution | |
| Eastern Natopia |
481,402,622 (47.07%) |
| Western Natopia |
541,405,437 (52.93%) |
| Most populous demesne |
Ziegeland 124,515,302 (12.17%) |
| Least populous demesne |
Ptia 724,879 (0.07%) |
| Policy impact | |
| Frenzy apportionment | 1744 Natopian Frenzy election |
| Government at enumeration |
FBJP Chancellor Emmanuel Aristarchus |
| Chronology | |
| Previous census | 1739 |
| Next census | 1747 |
| Demographics of Natopia | |

|
This article or section is a work in progress. The information below may be incomplete, outdated, or subject to change. |
The 1743 Natopian census was a demographic survey conducted by the Imperial Chancellery of Natopia's Ministry of Information through its Department of the Census. The census recorded a total population of 1,022,808,059 for the Bovic Empire of the Natopian Nation, reflecting a 0.67% increase from the previous census in 1739 AN.
The 1743 census was the last to include the demesne of Whales, which saw the Natopian withdrawal from Whales in IV.1744 AN after the Treaty of Sankt Rosa in 1743 AN.
Background
Methodology
Results
Total population
| Census Year | Total Population | Change from Prior Census | Annual Average Growth |
|---|---|---|---|
| 1739 AN | 1,015,969,469 | — | — |
| 1743 AN | 1,022,808,059 | +0.67% | +0.17% |
Population by demesne
| Demesne | Population (1743 AN) | % of Total Population | Change from 1739 AN |
|---|---|---|---|
| Eastern Natopia | |||
| Ziegeland | 124,515,302 | 12.17% | +0.60% |
| Tas Neemia | 99,701,433 | 9.75% | +0.72% |
| Nova Alrodria | 8,943,419 | 0.87% | +1.00% |
| Hazelwood | 48,654,207 | 4.76% | +0.80% |
| Lindstrom | 19,072,393 | 1.86% | +0.48% |
| Sororiya | 52,555,973 | 5.14% | +0.88% |
| Universalis | 32,527,959 | 3.18% | +0.40% |
| Klaasiya | 83,457,161 | 8.16% | +0.64% |
| New Dracoheim | 9,631,794 | 0.94% | +0.32% |
| Ptia | 724,879 | 0.07% | +0.20% |
| Athlon | 854,689 | 0.08% | +0.24% |
| Naya Island | 763,413 | 0.07% | +0.28% |
| Eastern Natopia Subtotal | 481,402,622 | 47.07% | |
| Western Natopia | |||
| Arboria | 57,442,773 | 5.62% | +0.72% |
| Whales | 927,330 | 0.09% | +0.40% |
| Dos Gardenias | 44,340,490 | 4.34% | +0.80% |
| Tapfer | 109,183,220 | 10.67% | +0.68% |
| Baudrix | 77,194,504 | 7.55% | +0.64% |
| Arboria del Sur | 50,193,046 | 4.91% | +0.76% |
| Saint Andre | 39,285,857 | 3.84% | +0.88% |
| Transegale | 42,345,649 | 4.14% | +0.56% |
| Mar Sara | 17,978,189 | 1.76% | +0.48% |
| Neridia | 99,011,469 | 9.68% | +0.60% |
| Geneva | 3,502,910 | 0.34% | +0.40% |
| Western Natopia Subtotal | 541,405,437 | 52.93% | |
| Total | 1,022,808,059 | 100.00% | +0.67% |
Demographic breakdown
Age distribution
Gender distribution
Geographic distribution
Ethnic composition
Religious affiliation
Economic indicators
Employment rates
Income distribution
Education levels
Impact and policy implications
The 1743 census data was used to apportion seats in the Frenzy for the 1744 Natopian Frenzy election.