List of countries by population: Difference between revisions
From MicrasWiki
Jump to navigationJump to search
No edit summary |
No edit summary |
||
| Line 323: | Line 323: | ||
| | | | ||
| | | | ||
|{{AN| | |{{AN|1724}} | ||
| | | | ||
| | | | ||
Revision as of 14:05, 26 September 2023
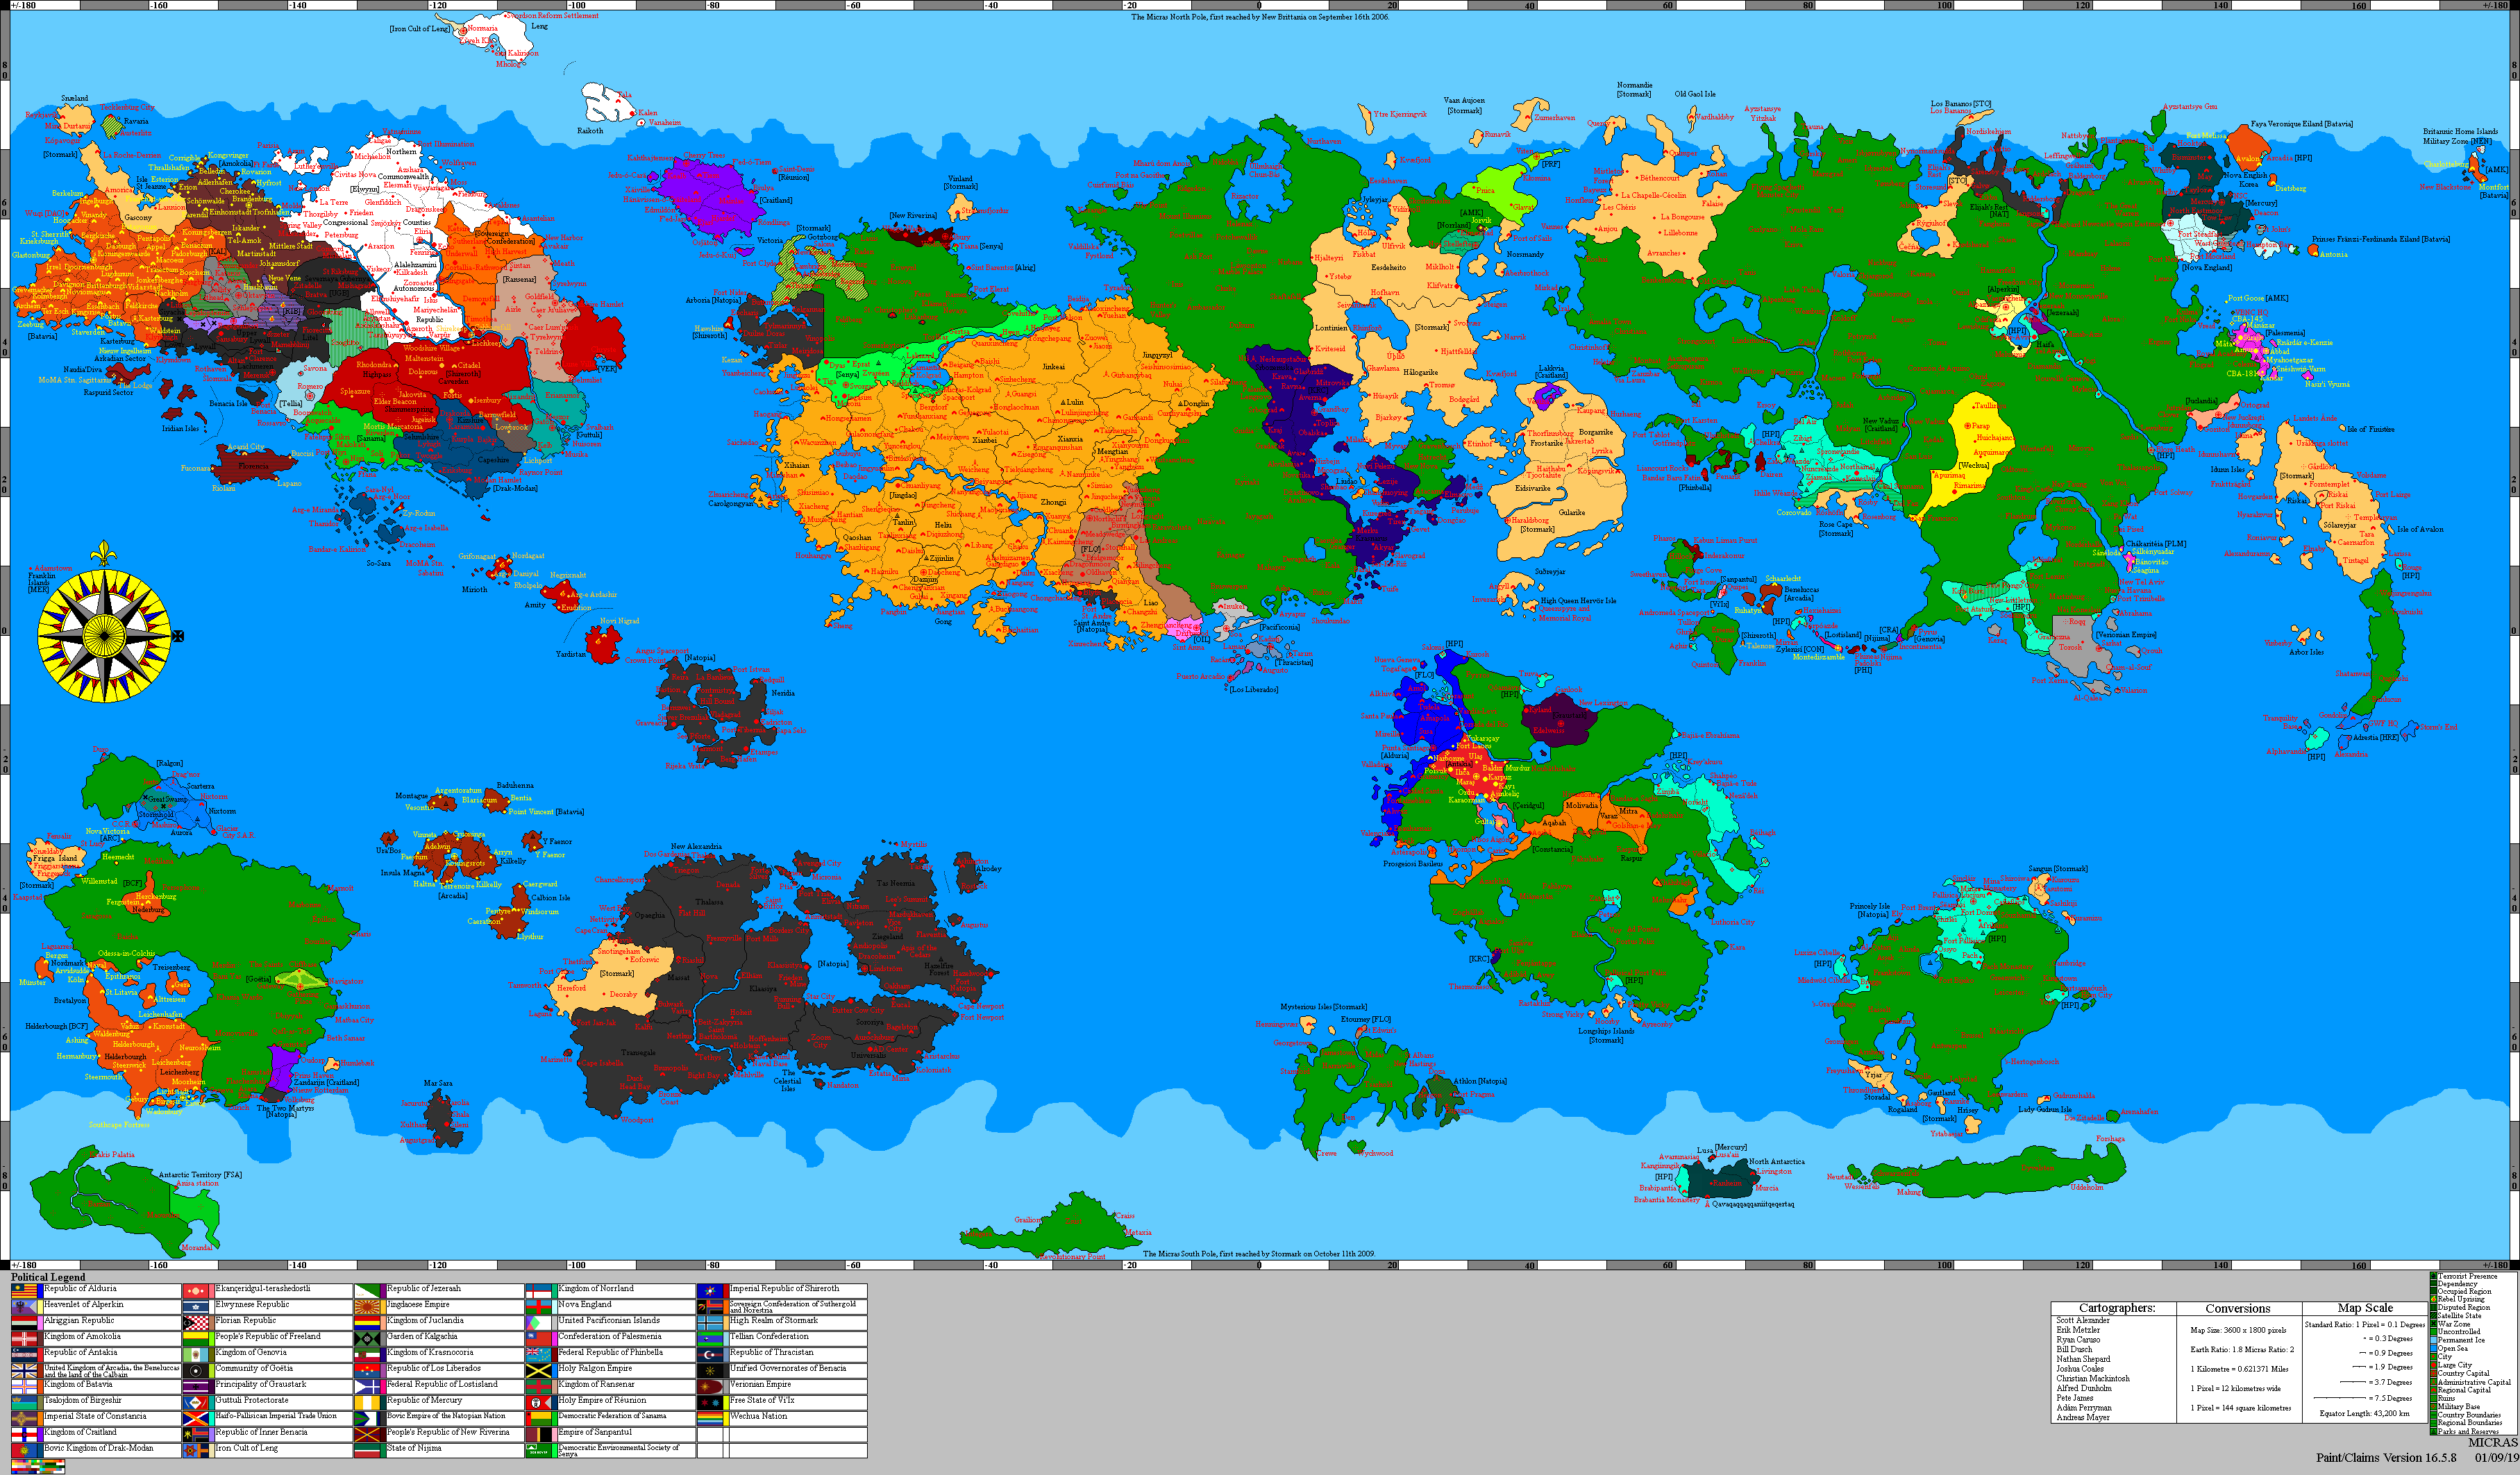
The following is a list of countries by population. It includes all sovereign states recognised by MCS as of Map version 16.5.8. Dependent territories are italicised and listed in alphabetical order below their parent country.
The exact population of Micras was never known, but many estimate 2.5 to 4.2 billion people inhabit the planet.
| Country | Population | % of Micras | Year (Gregorian) | Year (AC) | Year (AL) | Year (AN) | Year (ASC) | Year (EC) | Year (EGA) | Year (PSSC) | |
|---|---|---|---|---|---|---|---|---|---|---|---|
| 2,500,000 | 0.06% | 2022 | 1709 AN | ||||||||
| 66,992,418 | 1.74% | 2022 | 1706 AN | ||||||||
| 4,521,000 | 0.12% | 2022 | 1704 AN | ||||||||
| 290,113,513 | 7.53% | 2022 | 1715 AN | ||||||||
| 954,508,348 | 24.79% | 2023 | 1720 AN | ||||||||
| 17,632,722 | 0.46% | 2021 | 1696 AN | ||||||||
| 23,132,188 | 0.60% | 2020 | 1680 AN | ||||||||
| 22,000,000 | 0.57% | 2020 | — | ||||||||
| 250,000 | 0.01% | 2020 | 1687 AN | ||||||||
| 141,723,860 | 3.68% | 2023 | 1721 AN | ||||||||
| 1,135,000 | 0.03% | 2021 | 1703 AN | ||||||||
| 45,672,814 | 1.19% | 2022 | 1705 AN | ||||||||
| 15,421,352 | 0.40% | 2021 | 1696 AN | ||||||||
| 232,569,000 | 6.04% | 2023 | 1717 AN | ||||||||
| 5,292,828 | 0.14% | 2020 | 1687 AN | ||||||||
| 18,499,953 | 0.48% | 2020 | 1686 AN | ||||||||
| 675,000 | 0.02% | 2022 | 1705 AN | ||||||||
| 1,600,000 | 0.04% | 2021 | 1699 AN | ||||||||
| 7,081,179 | 0.18% | 2021 | 1693 AN | ||||||||
| 97,385 | 0.00% | 2020 | 1690 AN | ||||||||
| — | — | 2010 | — | ||||||||
| 6,608,456 | 0.17% | 2023 | 1722 AN | ||||||||
| — |
424,594 | 0.01% | 2023 | 1722 AN | |||||||
| — |
8,981 | 0.00% | 2023 | 1722 AN | |||||||
| 13,836,254 | 0.36% | 2019 | — | ||||||||
| 64,303,984 | 1.47% | 2023 | 1724 AN | ||||||||
| 374,686,235 | 9.73% | — | 1690 AN | ||||||||
| 24,700,000 | 0.64% | 2020 | — | ||||||||
| 10,770,940 | 0.28% | 2021 | 1703 AN | ||||||||
| 240,353,257 | 6.24% | 2021 | 1703 AN | ||||||||
| 2,675,000 | 0.07% | 2022 | — | ||||||||
| 38,000,000 | 0.99% | 2021 | — | ||||||||
| 890 | 0.00% | 1997 | 1411 AN | ||||||||
| 119,125,822 | 3.09% | 2022 | 1714 AN | ||||||||
| 41,712,822 | 1.08% | 2022 | 1711 AN | ||||||||
| 1,019,254,180 | 26.47% | 2022 | 1715 AN | ||||||||
| 11,813 | 0.00% | 2020 | 1686 AN | ||||||||
| 15,938,821 | 0.41% | 2023 | 1720 AN | ||||||||
| 5,000,000 | 0.13% | 2019 | — | ||||||||
| 2,876,120 | 0.07% | 2022 | 1707 AN | ||||||||
| 27,050,770 | 0.70% | 2021 | 1693 AN | ||||||||
| Total | 3,851,082,825 | 100.00% | |||||||||