Craitland general election, 1652: Difference between revisions
From MicrasWiki
Jump to navigationJump to search
| Line 2: | Line 2: | ||
==Results== | ==Results== | ||
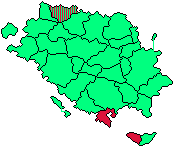
[[File:Craitish parliament counties 2017.png|thumb|]] | [[File:Craitish parliament counties 2017.png|thumb|{{legend|#00FF7F|Liberal-Centre Alliance: 30}} {{legend|#DC143C|Social Democrats: 3}} ]] | ||
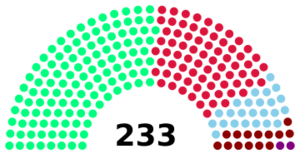
[[File:Craitish parliament 2017.png|thumb|{{legend|#00FF7F|Liberal-Centre Alliance: 120}} {{legend|#DC143C|Social Democrats: 73}} {{legend|#87CEEB|United Conservatives: 24}} {{legend|#8B0000|Solidarity: 14}} {{legend|#800080|National Party: 2}} ]] | [[File:Craitish parliament 2017.png|thumb|{{legend|#00FF7F|Liberal-Centre Alliance: 120}} {{legend|#DC143C|Social Democrats: 73}} {{legend|#87CEEB|United Conservatives: 24}} {{legend|#8B0000|Solidarity: 14}} {{legend|#800080|National Party: 2}} ]] | ||
{| border="1" cellpadding="4" cellspacing="0" class="wikitable" style="border-collapse: collapse; text-align:center" | {| border="1" cellpadding="4" cellspacing="0" class="wikitable" style="border-collapse: collapse; text-align:center" | ||
Revision as of 00:37, 29 October 2017
The Craitland general election, 1652 was the twelfth general election to be held in Craitland, and was held in September 2017 (the year 59 AC, by Craitish dating). The election was held using mixed-member proportional representation voting and was won by a Liberal-Centre Alliance majority government led by Prime Minister Iņa Aärnesen.
Results
| Political party | Leader | Votes | Elected; proportion | Elected; counties | Elected; total | % of votes | % of seats | |
|---|---|---|---|---|---|---|---|---|
| Liberal-Centre Alliance | Iņa Aärnesen | 3,850,626 | 90 | 30 | 120 | 45.1% | 51.5% | |
| Social Democrats | 2,998,987 | 70 | 3 | 73 | 35.13% | 31.33% | ||
| United Conservatives | 1,013,962 | 24 | 0 | 24 | 11.88% | 10.3% | ||
| Solidarity | 576,909 | 14 | 0 | 14 | 6.76% | 6.01% | ||
| National Party | 77,115 | 2 | 0 | 2 | 0.9% | 0.86% | ||
| Minor parties/Independents | N/A | 20,014 | 0 | 0 | 0 | 0.23% | 0% | |
| Total | 8,537,613 | 200 | 33 | 233 | ||||
| |||||||||||||||||||||||||||||||


