Craitland general election, 1592: Difference between revisions
From MicrasWiki
Jump to navigationJump to search
No edit summary |
m (Craitman moved page Craitland general election, 2012 to Craitland general election, 1592 without leaving a redirect) |
||
| (3 intermediate revisions by the same user not shown) | |||
| Line 1: | Line 1: | ||
The '''{{PAGENAME}}''' was the seventh general election to be held in [[Craitland]], and was held | The '''{{PAGENAME}}''' was the seventh general election to be held in [[Craitland]], and was held on 1.IX.{{AN|1592}} (the year 39 [[AC]], by Craitish dating). The election was held using [[wikipedia:Mixed-member proportional representation|mixed-member proportional representation]] voting and was won by a [[Social Democrats (Craitland)|Social Democrats]] majority government led by [[Prime Minister of Craitland|Prime Minister]] [[Jan Loresen]]. | ||
==Results== | ==Results== | ||
| Line 84: | Line 84: | ||
|} | |} | ||
{{Craitish politics}} | |||
[[Category:Elections]] | [[Category:Elections]] | ||
Latest revision as of 20:32, 27 January 2022
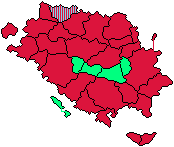
The Craitland general election, 1592 was the seventh general election to be held in Craitland, and was held on 1.IX.1592 AN (the year 39 AC, by Craitish dating). The election was held using mixed-member proportional representation voting and was won by a Social Democrats majority government led by Prime Minister Jan Loresen.
Results
| Political party | Leader | Votes | Elected; proportion | Elected; counties | Elected; total | % of votes | % of seats | |
|---|---|---|---|---|---|---|---|---|
| Social Democrats | Jan Loresen | 3,789,995 | 90 | 27 | 117 | 44.89% | 50.21% | |
| Liberal-Centre Alliance | 2,259,726 | 54 | 5 | 59 | 26.76% | 25.32% | ||
| United Conservatives | 1,973,699 | 47 | 1 | 48 | 23.37% | 20.6% | ||
| Solidarity | 263,781 | 6 | 0 | 6 | 3.12% | 2.58% | ||
| National Party | 136,799 | 3 | 0 | 3 | 1.62% | 1.29% | ||
| Minor parties/Independents | N/A | 19,782 | 0 | 0 | 0 | 0.23% | 0% | |
| Total | 8,443,782 | 200 | 33 | 233 | ||||
| |||||||||||||||||||||||||||||||


