Gustaaf Vermeylen/Arky's tutorial
This is Arky's tutorial for creating detailed maps. This provides insight into the methods and procedures used to create these detailed maps. However, this tutorial does not rule out the possibility that methods and procedures may change or adapt over time.
How it began
Apart from my personal fascination with maps, I particularly enjoy drawing them. For me, it goes hand in hand with researching certain areas, their history, and earlier maps. Strangely enough, maps where little has been determined are more difficult to make than maps where development has already taken place.
I made the first maps for Batavia. Even before Batavia came to Micras, there was a map of the nation that lay between the Netherlands and Germany. When Batavia appeared on Micras, I created an increasingly detailed map over the years. Later, other nations under my control followed, such as Arcadia, Francia and Çakaristan.
It may be hard to believe, but until mid-2024, I worked with Microsoft Paint. There were two reasons for this: control over every pixel without blurring and my stubbornness about switching to something else. Nowadays, I work with Paint.net. And, much to Jonas' pride, I also work in layers. The most recent maps of Batavia, Francia, and Çakaristan have now been updated in those layers.
How to start
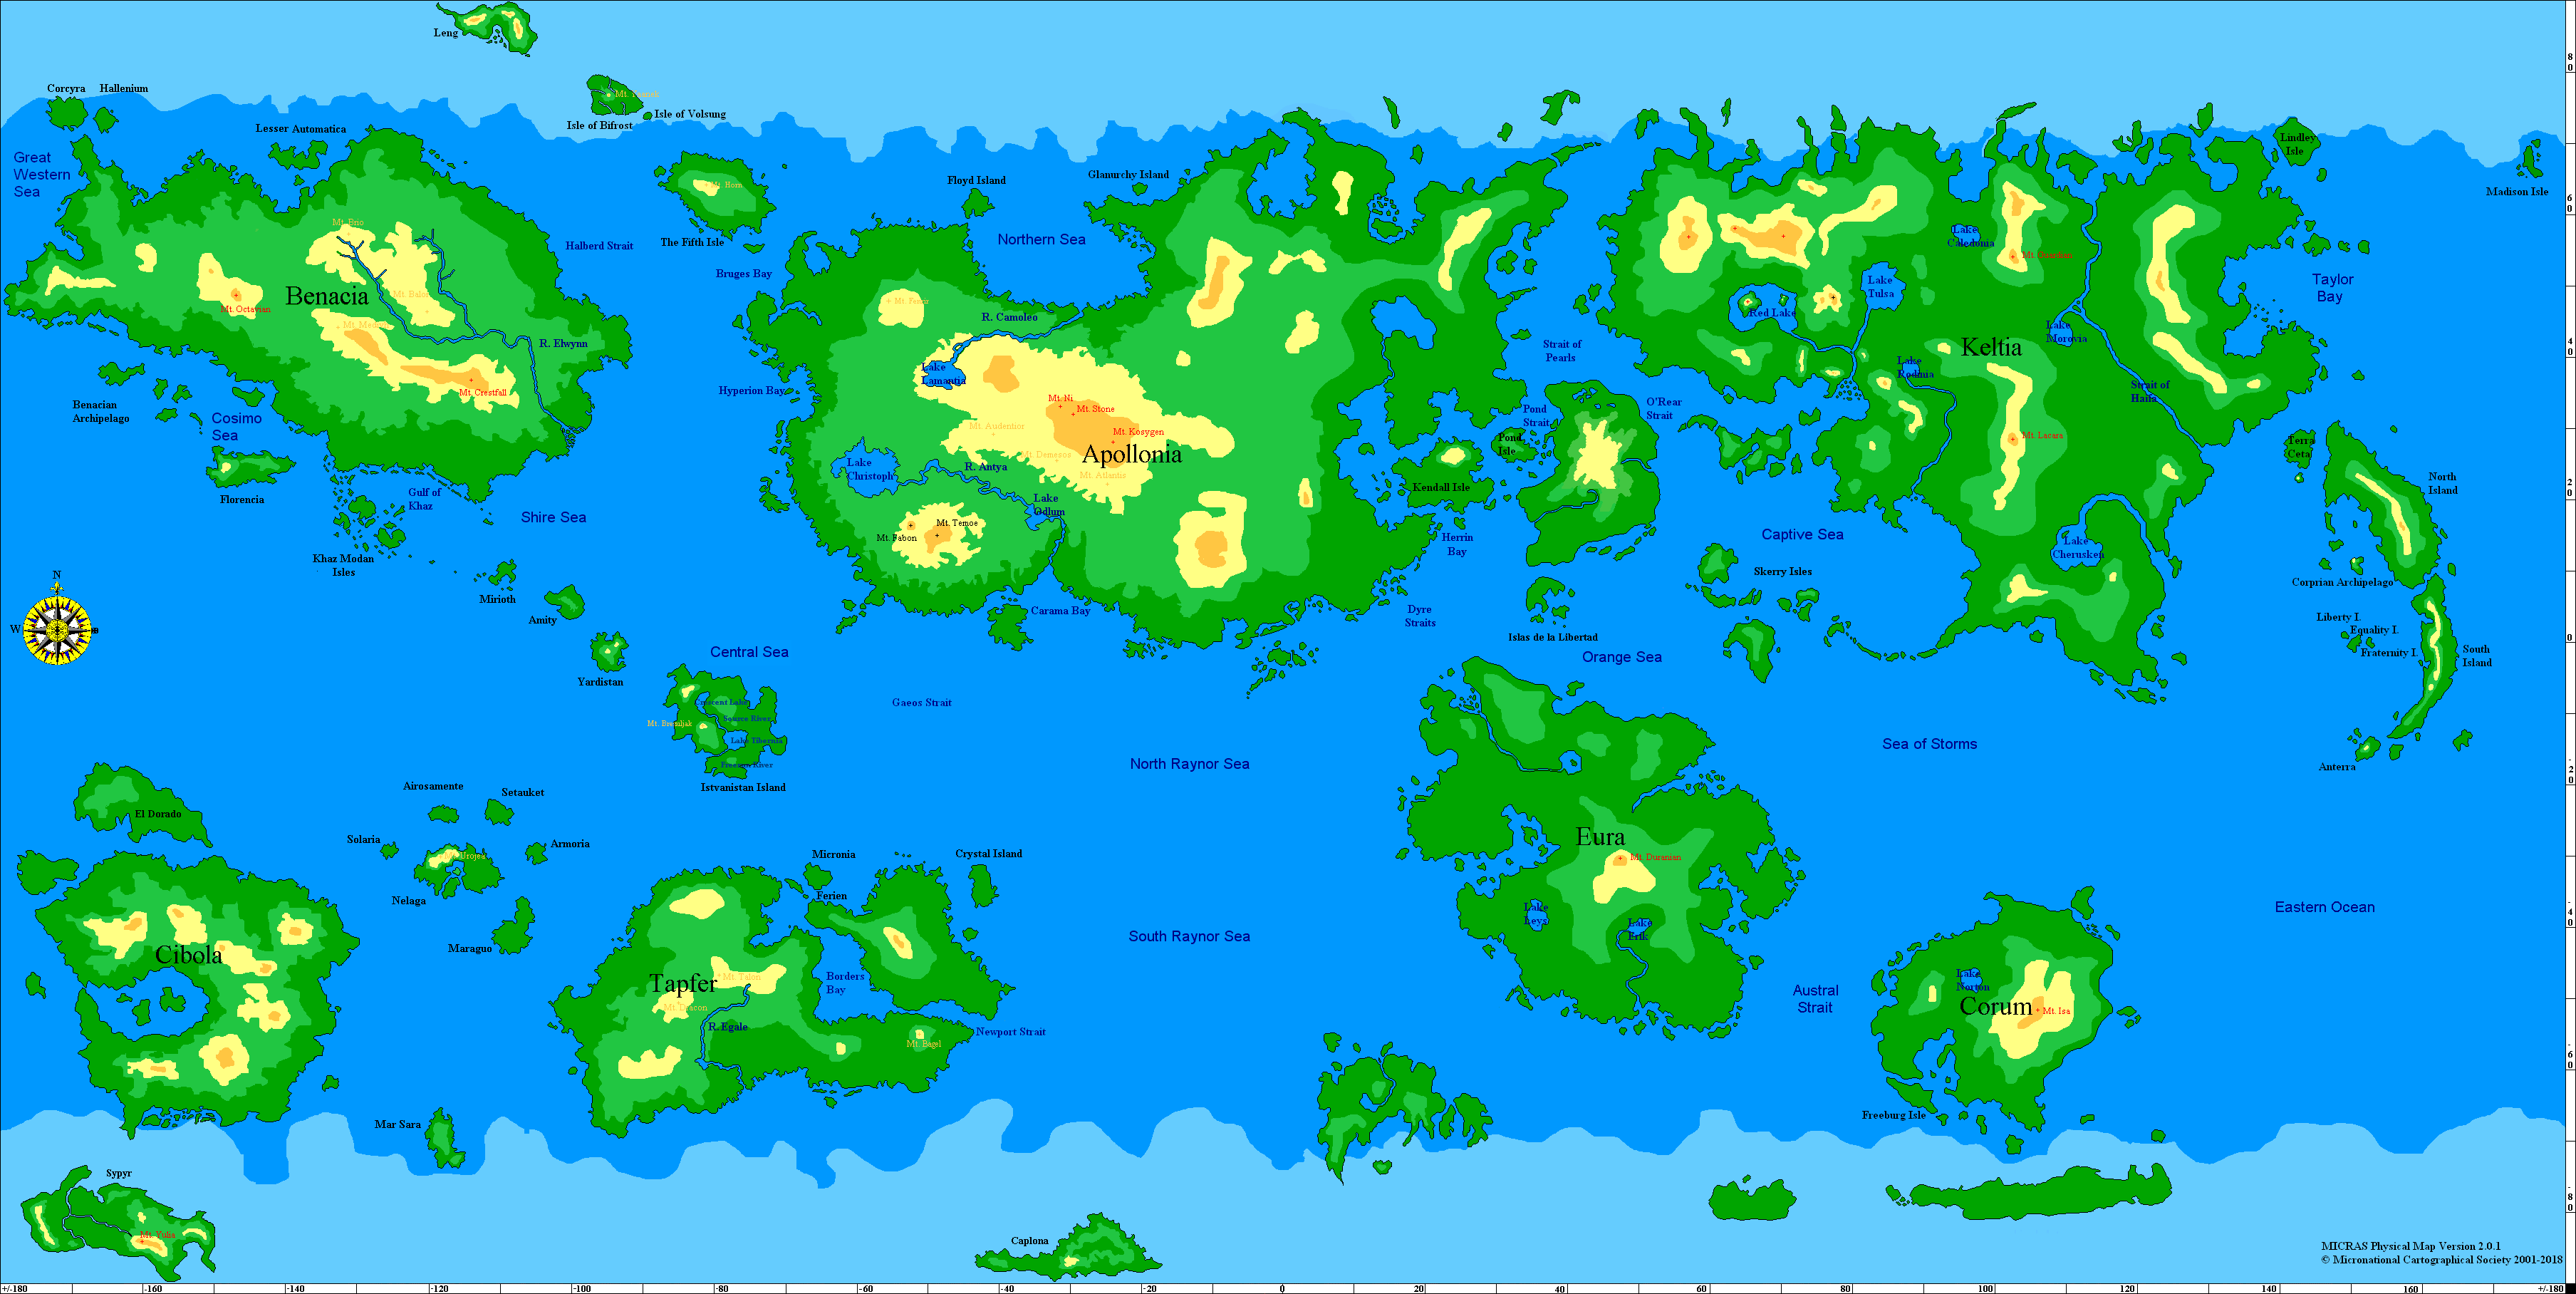
My way of starting is to lay a foundation. That means I begin with the physical map of Micras. It is unofficial nowadays, but it does help to have some kind of landscape to start with. My version of the physical map differs from the MCS physical map in that I have applied my color palette and incorporated some names. The reason for this is that the rapid expansion of Çakaristan happened too quickly for me to draw a detailed map of it. So I needed a physical map to include in my articles.
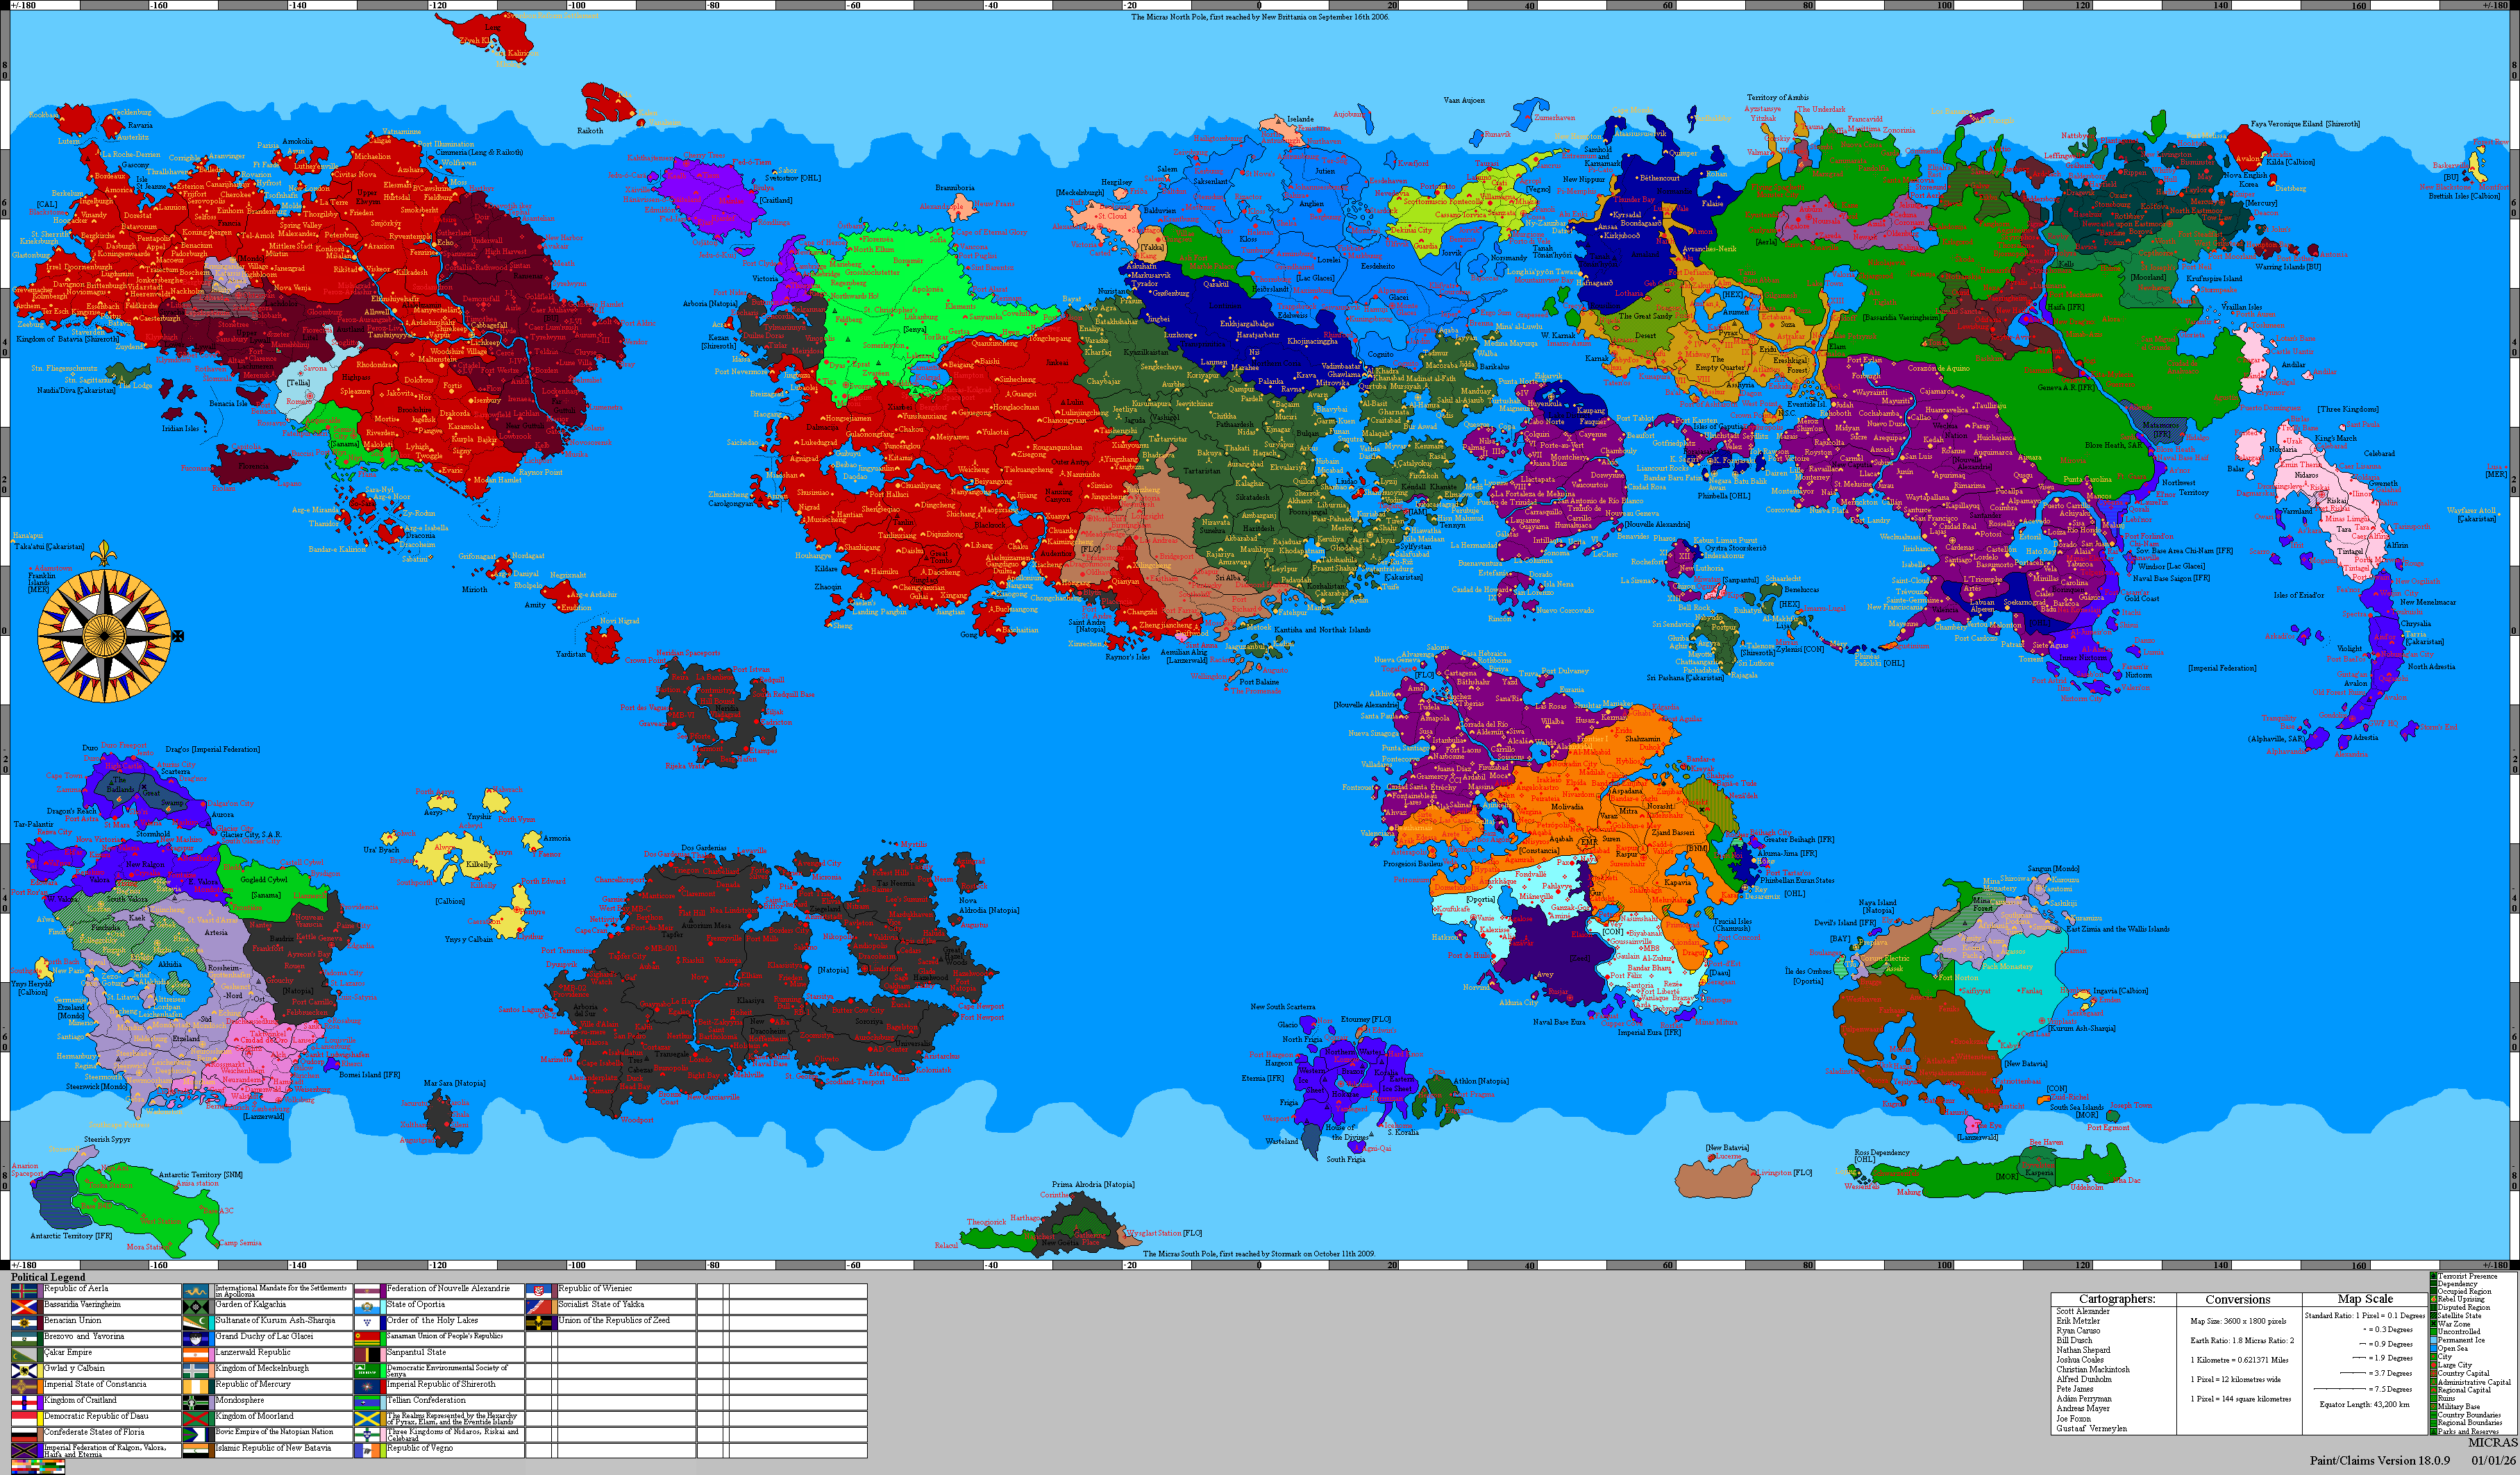
I place the MCS political map over this. I make the political colors transparent so that the physical map is visible.
And then I enlarge the result 12 fold. The reason for this is that the MCS maps are scaled at 1 pixel = 12 km2. So the detailed maps have a scale of 1 pixel = 1 km2. Perhaps the size of roads (1 pixel wide) and symbols is still not proportional, but the maps are already becoming very large in size.
-
 The physical base map
-
 The political overlay


The layers I prepare in the Paint.net file are (from bottom to top):
- sea-grey base
- basemap
- symbols
- texts
Additional layers are possible, but the file size of a Paint.net file is mainly determined by the number of layers. Therefore, it is wise to keep the number of layers limited especially with a larger surface area.
Research into earlier sources
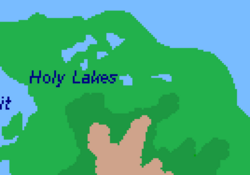
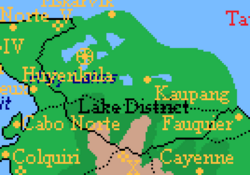
Before the fun begins, research previous sources. That means looking at previous maps and descriptions. It is striking that some parts of Micras have quite a lot of background information, while other parts have very little. Thanks to Micraswiki, it has become easier to find information. Unfortunately, not everything has been preserved. Old maps of the example area in this tutorial:
-
 Names of the Holy Lakes
-
 Old map of the Holy Lakes
-
 Municipals of the Holy Lakes
-
 Highways and railways


In addition to the old maps and existing descriptions, there is, of course, the input from the area controller. They often have an idea about their area, what kind of landscape it has, the towns and villages, and special places (castles, palaces, etc.).
Finally drawing
Finally, we have arrived at the stage of drawing the detailed map. The order in which you draw does not really matter. In terms of layers, I project a “sea-gray base” layer over the physical map and the political map. As the name of the layer suggests, it consists of sea and other larger bodies of water and gray. The reason this layer is separate from the other layers is that if I project multiple nations onto one canvas, this layer is the remaining part of the map when selecting to view a single nation.
The “basemap” layer is the layer in which I draw the landscape, the places and the roads. My working method is mainly to draw the large elements first, such as mountains, lakes and rivers. But because the physical map is not always (or usually) taken into account when creating the MCS political map, you sometimes have to be creative. If cities on the political map are located on top of a mountainous area on the physical map, I draw a valley there. The location of borders is often based on geographical elements, such as rivers and ridges. So I draw that idea. The location of towns and villages is often based on a crossroads, a river mouth or something similar, which I try to reflect.
The roads, railway lines and ferries follow the landscape. Because older maps often draw ‘too straight’, I take some liberty to make roads and such a bit more organic in the landscape. I often draw highways later, because in the real world they were also built later. National borders are included when drawing the landscape, and I include regional borders when drawing the roads.
The result is often a combination of preliminary sketches and spontaneous ideas. The general impression of what a landscape will look like is often already there, because it follows from the physical map and the earlier descriptions. What I try to avoid includes straight lines, rapid transitions between landscape elements, and single pixels. So there are no single-pixel forests on the map; they are always larger.
Then comes the layer with the symbols. The symbols used can be found in the legend. I can sometimes find the airports on the list of airports. Castles, military bases, palaces and monuments often follow from previous descriptions. I make up the lighthouses myself.
Finally, the layer with the text. I write capital cities in bold and underlined. I write the cities that appear on the political map in larger letters. The villages in smaller letters. The text accompanying symbols is in italics. The text accompanying bodies of water is in blue italics, forests in green italics and mountains in brown italics.
-
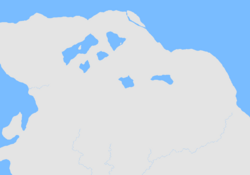 The sea-gray base layer
-
 The basemap layer
-
 The symbols overlay
-
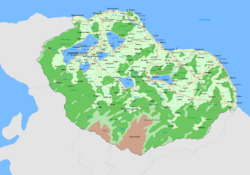 The texts overlay


Colour chart
| Component | Hexadecimal color |
|---|---|
| Agriculture | #D5FFD5 |
| Buildings | #FFCE9D |
| Forest | #6BC761 |
| Grey | #E4E4E4 |
| Heath | #C8BFE7 |
| Marsh | #94D78C |
| Mudflat | #99D9EA |
| Rocky | #CFA38B |
| Tundra | #B4E3AE |
| Sand | #FFFF84 |
| Sea ice | #D2E9FF |
| Snow | #FFFFFF |
| Water | #79BCFF |
| Ferry | #00A2E8 |
| Highway | #ED1C24 |
| Railway | #C3C3C3 |
| Road | #FFA042 |
Trivia
- Drawing rivers and streams isn't necessarily fun, but listening to this music makes it bearable.
- The scaling of Batavia's first “green” map was not done at 12 times the MCS map, which meant that the entire map had to be corrected when drawing the map for the Benacian Union.