Dependency of Tanah-Baru: Difference between revisions
Newzimiagov (talk | contribs) No edit summary |
Newzimiagov (talk | contribs) |
||
| Line 51: | Line 51: | ||
|- | |||
| 36.00 [[PSSC]] || 1,068,992 || -8,464 (-.79%) || 390,019 (.36) || 424,652 (.39) || 236,651 (.22) || .36 || 11 || 43 | |||
|- | |- | ||
| 35.80 [[PSSC]] || 1,077,457 || -7,987 (-.74%) || 411,711 (.38) || 429,857 (.39) || 195,266 (.18) || .53 || 11 || 43 | | 35.80 [[PSSC]] || 1,077,457 || -7,987 (-.74%) || 411,711 (.38) || 429,857 (.39) || 195,266 (.18) || .53 || 11 || 43 | ||
Revision as of 18:15, 14 August 2017
| Dependency of Tanah-Baru Hed Danu Amáienéi hed Livói (The Dead Renew the Living) | |||
| |||

| |||
| Capital | Soekarnograd | ||
| Major cities | Soekarnograd | ||
| Demonym | Petrosian | ||
| - Adjective | Petrosian | ||
| Area | 545,328 km² | ||
| - Ranked | |||
| Population | 1,147,321 (909 WG) | ||
| - Ranked | |||
| Density | 2.1/km² | ||
| Abbreviation | TB | ||
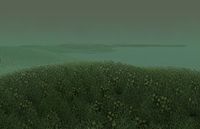
Originally established in 627 WG, the region of Tanah-Baru was once the proud home of the capital of the Federal Republic of Los Bay Petros, one of a handful of nations which came to dominate Southern Keltia during that region's golden age, which spanned from roughly 600 WG until 716 WG. Today, over one-hundred years after the fall of Los Bay Petros, the swamp-covered region of Tanah-Baru is primarily home to a number of communities of Petrosian and Interlandian pirates and fisherman who largely reject and resent the operations of the Keltian Drilling and Exploration Agency, which extracts and exports natural gas from the region, on behalf of New Zimian investors. Conflict between the company and the region's inhabitants is not uncommon, though the government of Passio-Corum has adopted measures to try to provide representation for those who make their home in the region.
In addition to the local communities of Petrosian and Interlandlian pirates, the swamps of Tanah-Baru are known to be the home of a mystical and savage race of people who subsist by scavenging off the corpses of dead animals.
Region Statistics
| Year | Population | Growth (Growth %) | Food Imports (/Person) | Fuel Imports (/Person) | Other Imports (/Person) | Immigration Modifier (%) | Seats in Regional Government | Seats in Houses of Corum
|
|---|---|---|---|---|---|---|---|---|
| 36.00 PSSC | 1,068,992 | -8,464 (-.79%) | 390,019 (.36) | 424,652 (.39) | 236,651 (.22) | .36 | 11 | 43 |
| 35.80 PSSC | 1,077,457 | -7,987 (-.74%) | 411,711 (.38) | 429,857 (.39) | 195,266 (.18) | .53 | 11 | 43 |
| 35.60 PSSC | 1,085,436 | 13,320 (1.23%) | 352,856 (.32) | 504,965 (.46) | 187,223 (.17) | .54 | 11 | 43 |
| 35.42 PSSC | 1,072,116 | -10,142 (-.95%) | 407,790 (.38) | 341,667 (.31) | 244,099 (.22) | .65 | 11 | 43 |
| |||||||||||

